These questions are traditionally solved using optimization over time frame, so we build a system that we later test on each and every time frame starting from 1 minute to say one day and choose the best performing one.
Unfortunately usefulness of such approach can be questioned because once optimum values can become invalid very quickly and frequent re-optimization is simply repetitive curve-fitting over and over again.
So what is the solution? Should we just stick to our once “favorite” all the time? Is there any other way?
The idea
The proposal of the solution that will be presented here can be summarized in one sentence: instead of using one time frame use all possible time frames (within some range) at once in the form of composite indicator.
Classic indicators produce signal in the form of single “buy” or “sell” at a time. In voting-based multiple time frame indicators we will blend (compose) the signals coming from hundreds of different time frames into one indicator that will represent a result of “voting” for buy or sell in different intervals.
Multiple time-frame MACD
The construction of multiple time-frame indicator consists of 4 stages:
1. Definition of signals
2. Generation of signals over multiple time frames
3. Summing up the signals into composite indicator
4. Normalization
In the first example we will show how to calculate multiple time-frame MACD.
In the first step we define our buy and sell rules. For this example, we will use MACD system that generates “BUY” signal when MACD is above zero and “SELL” signal when MACD is below zero.
In the second step we run MACD over every time frame ranging from 10-minute to 300 minutes, each interval generating its own buy and sell signals.
In the third step we count each buy as +1 and each sell as -1 and calculate sum of those signals coming from different time frames.
And in the last stage we normalize the indicator by dividing the sum calculated in previous step by number of time frames we used.
This way we obtain bounded multiple-timeframe indicator ranging from -1 to +1 that represents a “blend” of signals coming from multiple time frames at once. Positive values represent composite buy signal while negative values represent composite sell signal.
Below is a sample Amibroker code that actually calculates multiple-time frame MACD. As you can see the coding is pretty simple and short, because of Amibroker native support for handling multiple time frames. These TimeFrame functions allow the user to mix different intervals in single formula with ease. Since the formula is rather computationally intensive we perform calculation once and store results in artificial data symbol (using AddToComposite function) that we will use later for plotting (so it does not need to be re-calculated).
Formula 1. Multiple time-frame MACD. Note: in order to run this code and calculate multiple time-frame MACD, enter it into Automatic Analysis (AA) window, go to Settings window, make sure that Periodicity is set to 1-minute. Then press "Scan" button in the AA window.
Count = 0;

    result = 0;


    for( i = 10;
    i <= 300; i++ )

    {

       TimeFrameSet(
    i * in1Minute );

       m = MACD(12, 26 );

       TimeFrameRestore();

       m = IIf( TimeFrameExpand(
    m, i * in1Minute ) > 0, 1,
    -1 );

       result = result + m;

       Count++;

    }


    AddToComposite( result
    / Count, "~MACD"+Name(), "X" );

  Buy=1;
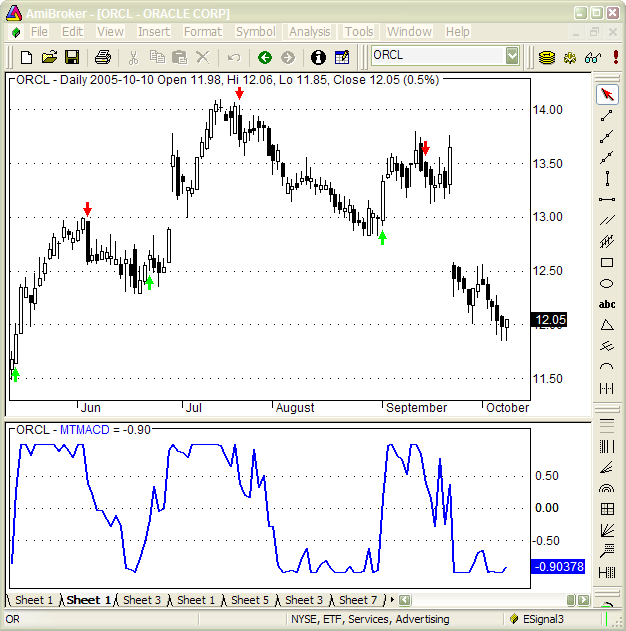
In
the figure below we can see daily chart of ORCL (upper pane) with buy and
sell arrows generated using multiple time-frame MACD and multiple time-frame
MACD indicator plotted in the bottom pane. Buy signal is generated when
MTMACD crosses above -0.5 line and sell is generated when MTMACD drops
below +0.5 line. Note the MTMACD saturation levels at -1 and +1 which indicate
bars when all timeframes voted for sell or for buy.
Actual plotting code is presented below. Note that we are using Foreign function to retrieve indicator values stored in artificial ticker. That way we don't need to re-calculate it.
Formula 2. Multiple time frame MACD plot (indicator) code. Use Formula editor to enter then press "Apply indicator" to display it.
x = Foreign("~MACD"+Name(),"C");


  Plot( x, "MTMACD", colorBlue , styleThick )
  ;


  PlotGrid(0.5 );

  PlotGrid(-0.5);
Extreme overbuy/oversell indicator (Multiple time-frame RSI)
In second example we will present an indicator that could be called “extreme overbought/oversell” indicator. It’s construction we will use RSI indicator to detect overbuy/oversell conditions occuring in different time frames. Overbuy signal will be generated when 14 bar RSI is above 70 and oversell will be generated when RSI is below 30. INnthe second step we will generate RSIs in every interval starting from 5 minute, through 10-, 15-, 20-, 25-, 30, 35- minute interval up to 360 minutes.
In the third step we will add 1 to the sum if RSI in given time frame is above 70, or subtract 1 from the sum if RSI in given time frame is below 30.
After calculating entire sum we will divide the result by number of components.
This will give us bounded indicator in -1… + 1 range, where values near -1 will signify extreme oversell and values near +1 will signify extreme overbuy.
Formula 3. Multiple time frame RSI. As before, run the formula in AA window using 1-minute periodicity selected in the Settings.
Count = 0;

    result = 0;


    for( i = 5;
    i <= 360; i = i
    + 5 )

    {

       TimeFrameSet(
    i * in1Minute );

       m = RSI();

       TimeFrameRestore();


       m = TimeFrameExpand(
    m, i * in1Minute );


       result = result + IIf(
    m > 70, 1, IIf(
    m < 30, -1, 0 )
    );

       Count++;

    }


    AddToComposite( result
    / Count, "~RSI"+Name(), "X" );

  Buy=1;
The code that plots actual indicator is as follows.
Formula 4.
x = Foreign("~RSI"+Name(),"C");

  GraphZOrder=1;


  Plot( x, "MTRSI", colorLightGrey );

  Plot( EMA(x, 7 ), "EMA(MTRSI,7)", colorBlue, styleThick );


  PlotGrid(1);

  PlotGrid(-1);
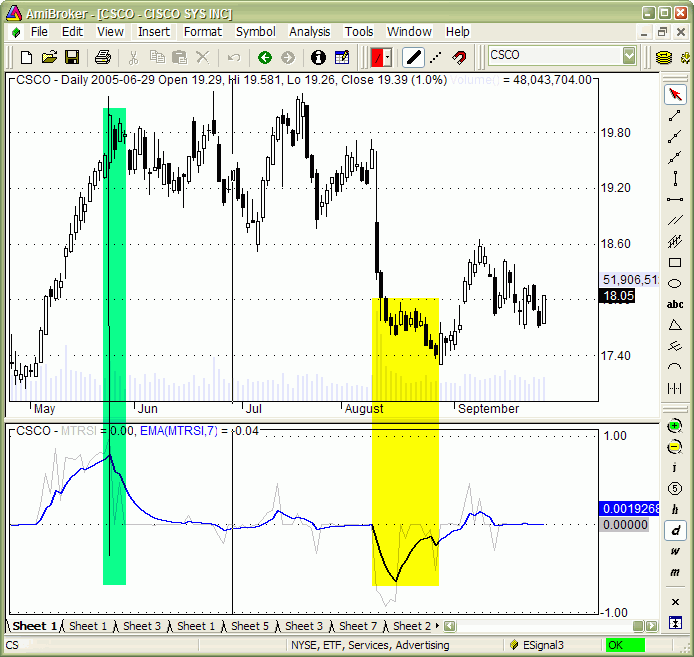
In the figure above we can see daily chart of CSCO plus extreme overbuy/oversell (light gray) and its 7 day moving average (blue). As we can see from the chart smoothed MTRSI peaks and troughs precisely show ends of large up trend and down trend moves. One stunning feature of this indicator is clarity of trend-ending signals. This indicator is perfect for timing the exits. As many researches have shown good exit timing is often more important than entry timing.
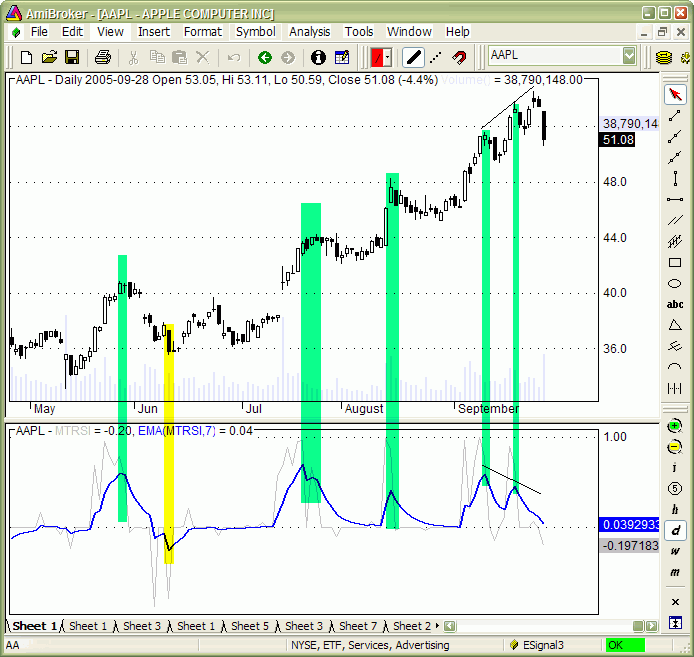
In this figure above you can see another example of MTRSI with very clear signals of local maximums during the trend. Even more stunning is the divergence that develops in the middle of September when prices continue to rise and MTRSI makes two peaks in clear downtrend. These leading signals helped to get out of trade just at the very end of very nice up trend.
Multiple time-frame ADX
Using the same concept we can create other multiple-time frame indicators. For example MTADX presented in this chart, was calculated by computing 14-bar ADX values in every time frame starting from 20 minutes upto 360 minutes with 20 minute increment and then summing them up and dividing by number of components.
Formula 5. Multiple time-frame ADX calculation
Count = 0;

    result = 0;


    for( i = 20;
    i <= 360; i = i
    + 20 )

    {

       TimeFrameSet(
    i * in1Minute );

       m = ADX();

       TimeFrameRestore();


       m = TimeFrameExpand(
    m, i * in1Minute );

       result = result + m;

       Count++;

    }

    AddToComposite( result
    / Count, "~ADX"+Name(), "X" );

  Buy=1;
Formula 6. Multiple time-frame ADX plot
x = Foreign("~ADX"+Name(),"C");


  Plot( x, "MTADX", colorBlue , styleThick )
  ;
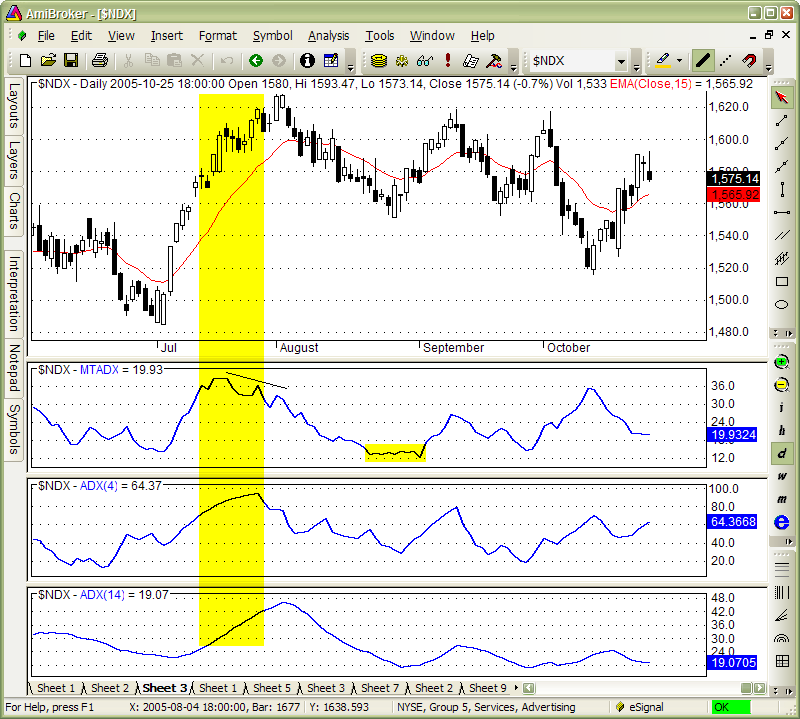
This has yielded to the indicator plotted in second pane. ADX is the indicator that shows how strong is the trend. As we can see multiple time-frame ADX very quickly reacts to forming uptrend, much quicker than original 14-day ADX (shown in the lowest pane). For illustration purposes in the middle I have inserted 4-day ADX which still lags behind multiple-time frame 14-bar ADX and is more choppy.
MTADX shows weakening of market trend way quicker.
This shows clear advantage of multiple-time frame indicators. They are leading indicators.
Multiple time-frame, multiple-security composites
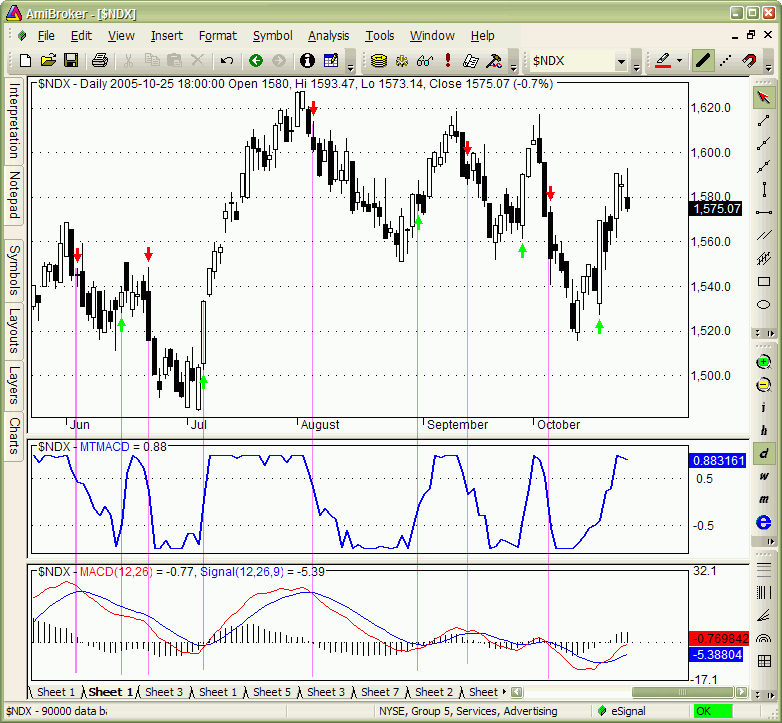
As I have shown previously multiple time frame indicators often provide leading signals and this makes them better than those based on end-of-day data, however, sometimes they lead only by very few bars. For example take a look at multiple time-frame MACD generated from Nasdaq 100 index compared to regular MACD (below). In most cases it leads standard MACD just by 1-3 bars. It is nice, but couldn’t this be nicer?
The answer is.... Yes they can do better work ... If you trade sector EFTs or index futures.
When one trades an index or some sector, it is popular practice to apply indicators on index data. Index is usually some form of average of its components. As an alternative to applying indicator to market average we can create average from indicators calculated separately for each component. As long as indicator does not represent simple linear transformation these two procedures yield to very different results. For example if we assign „buy” and „sell” meaning to certain indicator levels we can implement voting across securities that build up an index. This technique is now widely used among AmiBroker users because its’ built-in support for creating user-definable composites and the fact that it requires just one line of code to create composite in AmiBroker.
Creation of composite:
But during this research we went further than that. We did not only created
a multiple-security composite but we have used multiple time-frame indicators
as components of such composite. So each "MACD" block in the
schematics above represents multiple-time frame MACD calculated from single
security.
So this time voting is performed first in time-frame domain and then in security
domain and results are summed up to construct one indicator which we can
call multiple time frame MACD composite.
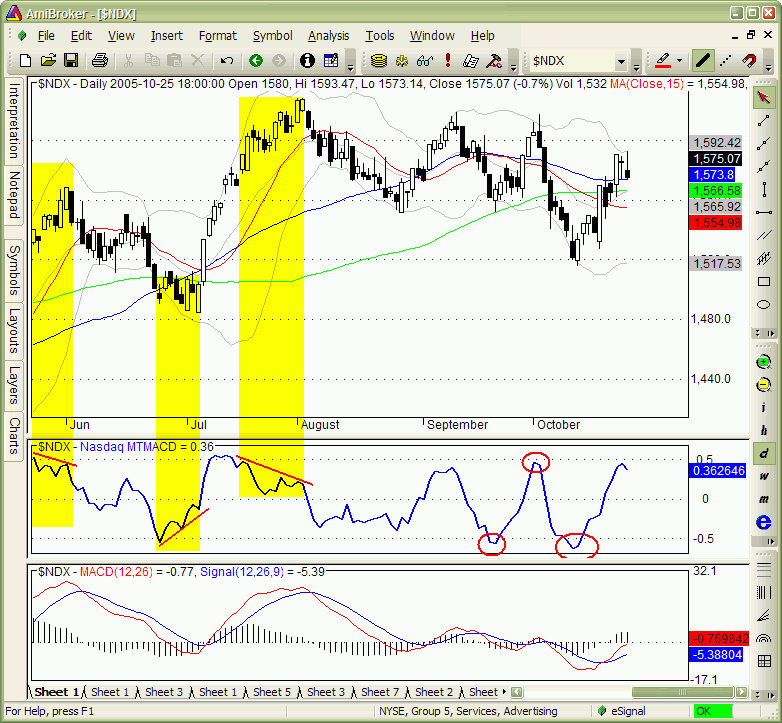
Here is how it looks. The middle pane shows multiple-time frame MACD composite calculated from MTMACDs computed for every Nasdaq100 component separately, then summed up together and divided by 100.
As you can see it is very different from single-security multiple-timeframe MACD. It is also very different from regular MACD calculated from index data directly. And what is most important - it leads the market movement by significantly more bars than its single-security counterpart.
Strong divergences show clearly trend change and levels of -0.5 and +0.5 show strong support and resistance.
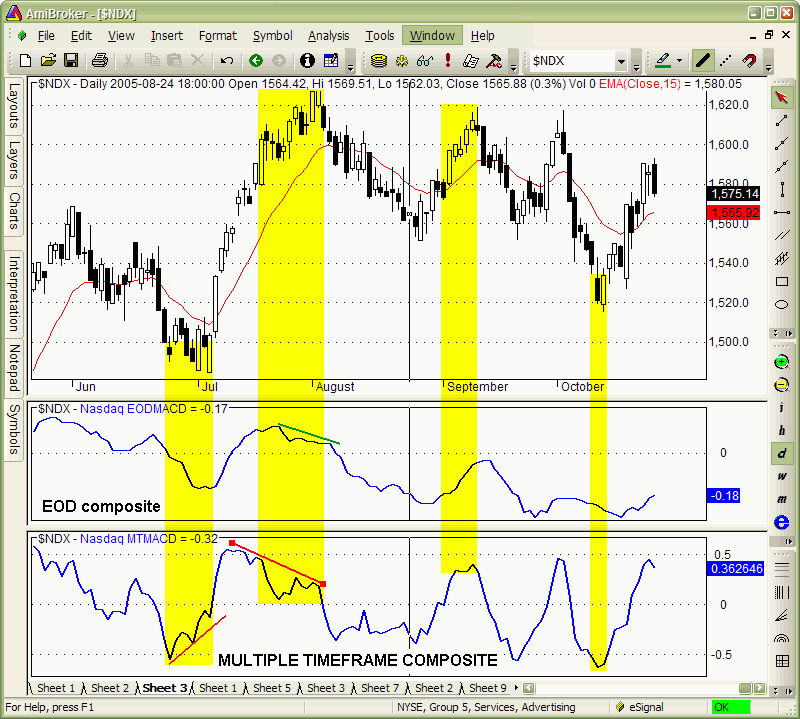
This chart shows comparison between composite based on multiple time frames (bottom pane) and composite based on end-of-day data (middle pane)
It is quite clear that multiple-time frame composite reacts much faster and also divergences shown here are clearer and easier to interpret.
Multiple time-frame indicators have zero or negative lag giving you an early alert for market reversal and allowing to trade before reversal actually happens.
AFL implementation is very easy and straightforward thanks to unique AmiBroker function AddToComposite. All it requires is one line of code that how individual component value is calculated and one AddToComposite line. Then such code is run over watch list of securities in AmiBroker’s Automatic Analysis window.
Formula 6. EOD composite generation. This formula should be run on watch list containing the members of Nasdaq 100 index.
AddToComposite( IIf( MACD() > 0, 1, 0), "~~Nasdaq_EOD_MACD", "X");

  Buy=0;
In multiple-time frame case we need to run the code over previously created artificial tickers that contain MTMACD values. So there are two passes: first pass to create MTMACDs for components using code presented few minutes earlier and second pass using this code that creates actual composite.
Computations are stored in artificial ticker that can be used anytime later without need to repeat calculations over and over again. This is quite important considering the fact that creation of individual MTMACDs for over 100 of symbols may take several minutes (depening on computer speed).
Formula 7. Multiple time frame composite generation. This formula should be run on the watch list containing only artificial tickers (starting with ~MACD) generated using Formula 1.
AddToComposite( C, "~~Nasdaq100MT_MACD", "X");

  Buy=0;
To plot multiple time frame MACD composite the following formula should be used.
Formula 7. Multiple time-frame MACD composite plot
x = Foreign("~~Nasdaq100MT_MACD","C")/100;


  Plot( x, "Nasdaq
  MTMACD", colorBlue , styleThick )
  ;


  PlotGrid(0.5 );

  PlotGrid(0);

  PlotGrid(-0.5);
Advantages and disadvantages
The multiple time-frame indicators I have presented here have many important advantages. First of all they provide leading trading signals.
Signals are provided in a clear way (for example extreme overbuy/oversell shows clear spikes on trend endings) so they can be interpreted easily even in automatic way. Multiple time frame indicators work on any kind of market as they basically use just 1-minute price series. Composite flavour of multiple time frame indicators is very useful for trading sector funds and/or index futures.
There are also some disadvantages of multiple time frame indicators but these are minor computer-related issues.
First of all these indicators are computationally intensive as they operate on lots of data and require often several minutes to calculate.
Also they require historical intraday data which may be a bit more expensive than end-of-day data
And the last thing is that computations shown here can be peformed only using program that is capable of manipulating multiple time frames at once and having ability to automatically compute and store composites (cross-security sums or averages). Good news is that AmiBroker is one of such sofwares and it is not expensive :-)
Possible improvements
As you can see multiple time frame indicators have lot of good things to offer, but let us think about future possible enhancements.
These improvements may include using different weight to each „vote”. The simplest way is to give more weight to longer time frames. More complex way would be to use weight that depends on past performance of particular time-frame. This way better-performing time-frames become more important in producing final signal than the others (worse-performing). This however resembles slightly constant re-optimization and such weight modification should be limited so we don’t end up in one time frame monopolising the system.
Conclusion
Multiple time frame indicators present interesting alternative to using "classic" indicators computed from EOD data. Position and swing traders may benefit from including them in their toolbox, since multiple time frame indicators react to market changes way faster than their EOD counterparts while still filtering most of the market noise present in smaller time frames.
-- Tomasz Janeczko, October 2005