How to use drag-and-drop charting interface
Introduction
AmiBroker allows you to easily create and modify your indicators
with a few moves of a mouse. From now on you can build sophisticated indicators
without any programming knowledge at all. The available (ready-to-use)
indicators are listed in the Charts tab of the Workspace window.
There is a video tutorial at: http://www.amibroker.net/video/dragdrop1.html that shows basic usage of new drag-and-drop functionality.
How to insert a new indicator.
To display a new indicator in a separate chart pane, just find
the indicator in the Charts list (use Window -> Charts menu) and double-click the
indicator name.
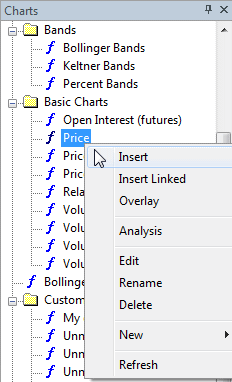
Alternatively, you can choose Insert from
the context
menu.
As a result, a new indicator pane will be created and the Parameters dialog
will be displayed. Here you can change the properties of the indicator
(like color or periods). To accept the settings, press the OK button.
(You will find the detailed description of the Parameters window below).
Example:
To insert an RSI pane - find the RSI indicator in the list, double-click the
name, select the number of periods and color, then press OK.
How to overlay one indicator on another indicator.
To overlay one indicator on another, press the LEFT mouse
button on the indicator name, drag (while holding the mouse button) the chosen indicator
into the destination pane and release the button.
Example:
To insert another RSI (based on a different number of periods) into the same pane -
drag RSI into the previously created RSI pane, change the number of periods
in the Parameters window and press OK
Alternatively, you can choose Overlay option from the context
menu.
How to delete the indicator.
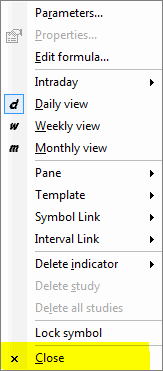
To remove the indicator, press the Close button from the
menu at the top right-hand side of the indicator pane (the menu will be displayed
if you place the mouse cursor nearby). This menu also allows you to
move the indicator pane up/down or maximize the pane.

You can also use the Close command from the context menu that shows
up when you click the chart pane with the right mouse button.
How to remove the indicator plot from the pane.
To remove one of the indicators displayed in the indicator
pane - click the RIGHT mouse button on the chart title (near the top of
the chart pane) and select the indicator that you want to remove.
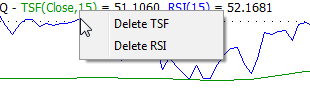
You can also remove the indicator plot using the Delete Indicator option
from the chart context menu.
How to change parameters/colors/styles of indicators.
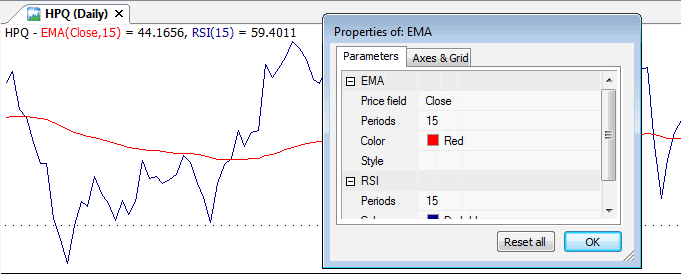
The Parameters window allows you to change parameters, colors and styles of your indicators. The Parameters window is displayed when you insert a new indicator. You can also right-click the chart pane and choose Parameters from the context menu. The Parameters window displays all the parameters defined in AFL code of certain indicators (also user-defined parameters), so its contents depend on the indicator chosen. However, for most of the indicators you will see:
- Price Field - the data used to calculate the indicator. If the 'Price Field' contains 'Close', it means that the indicator is calculated from Close prices.
- The Price Field is not available for all indicators, because not all indicators allow you to choose the input (e.g. ADLine).
- Periods - defines the number of periods used to calculate the indicator
- Color - allows you to change the color of the indicator
- Style - allows you to determine the style of the plot (the styles are described in more detail in Using graph styles and colors tutorial section.
How to overlay indicators with different scales.
To have two (or more) indicators that use different scaling in one pane, drag the second indicator onto the first one, in the Parameters window click the Style field and check the StyleOwnScale setting.
Example:
Drag OBV (On Balance Volume) into the RSI pane. Then define the style as StyleOwnScale. As a result, both indicators are visible and properly displayed.
How to create an indicator based on another indicator.
AmiBroker also allows you to easily create indicators based on the values of another indicator. All you need to do is to press the LEFT mouse button on the indicator name, drag (while holding the mouse button) the chosen indicator into the destination pane and release the button. As a result, the indicator will be placed in the existing chart pane. In the Parameters dialog, the Price field parameter indicates what base values are used to calculate the indicator.
Example:
To calculate a Simple Moving Average of a previously created RSI indicator, drag the MA indicator into the RSI pane. The contents of the "Price Field" parameter indicate that the Moving Average is calculated from RSI(15) values. (See the picture below).
NOTE: The part below contains technical information for
advanced users only. Beginners may skip this part.
Using Param(), ParamColor(), ParamToggle(), ParamStyle()
functions
These functions, when used in a formula, allow you to change indicators' settings directly from the Parameters window.
Param( ''name'', defvalue, min = 0, max = 100, step = 1, sincr = 0 )
Adds a new user-definable parameter, which will be accessible via the Parameters dialog.
- "name" - defines the parameter name that will be displayed in the Parameters dialog
- defvalue - defines the default value of the parameter
- min, max - define the minimum and maximum values of the parameter
- step - defines the minimum increment of the parameter via a slider in the Parameters dialog
- sincr - defines the increment of the default value when more than one section of the same kind is inserted (dropped) onto the chart. For example, if you insert the default Moving Average indicator into the same pane twice, the first moving average will be based on 15 periods, the other one on 25 (defvalue=15 + sincr=10)
ParamColor( ''name'', defaultcolor )
Adds a new user-definable color parameter, accessible via the Parameters dialog.
- ''name'' - defines the parameter name that will be displayed in the Parameters dialog
- defaultcolor - defines the default color value of the parameter
The ParamColor function allows you to use colorCycle as a default value. When you use the colorCycle parameter, the default color cycles through red, blue, green, turquoise, gold, violet, bright green, dark yellow when you insert your indicators into the same pane.
ParamStyle(''name'', defaultval = styleLine, mask = maskDefault ) -
allows you to select the styles applied to the plot from the Parameters window. Apart
from styles available in previous versions of AmiBroker, there are two new style
constants:
- styleHidden - a combination of styleNoDraw | styleNoRescale
- styleDashed - dashed line
The list of available styles displayed in the Parameters window depends on the mask parameter.
- maskDefault - Shows thick, dashed, hidden, own scale styles (this is the default mask for ParamStyle)
- maskAll - Shows all style flags
- maskPrice - Shows thick, hidden, own scale, candle, bar
- maskHistogram - Shows histogram, thick, hidden, own scale, area
ParamField(''name'', field = 3 ) - allows you to pick the Price field for the indicator (the field that is used to calculate values of the indicator). The function returns the array defined by field parameter. Default value = 3 returns the Close array. The possible values of field parameter are:
- -1 - ParamField returns the values of the indicator that was inserted as a first one into the pane, or Close if no indicator was present
- 0 - returns the Open array
- 1 - returns the High array
- 2 - returns the Low array
- 3 - returns the Close array (default)
- 4 - returns the Average array = (H+L+C)/3
- 5 - returns the Volume array
- 6 - returns the Open Interest array
- 7,8,9,.... - return values of indicators inserted into the pane.
ParamToggle(''name'',''values'',defaultval=0 ) - a function
that allows you to use boolean (Yes/No) parameters.
- ''name'' - the name of the parameter
- ''values'' - parameter values (separated by the | character, e.g. "No|Yes" -
the first string represents the false value, and the second string represents the true value)
- defaultval - the default value of the parameter
_
Example:
The indicator below allows you to check how the parameters work in the custom code. You can change settings from the Parameters dialog.
Buy = Cross(MACD(), Signal()
      );

    Sell = Cross(Signal(), MACD()
      );


    pricefield = ParamField("Price
      Field", 2);

      Color = ParamColor("color",colorRed);

      style = ParamStyle("style",styleLine,maskAll);

      arrows = ParamToggle("Display
      arrows", "No|Yes",0);

      Plot(pricefield,"My
      Indicator",Color,style);

      if(arrows)

      {

  PlotShapes(Buy*shapeUpArrow+Sell*shapeDownArrow,IIf(Buy,colorGreen,colorRed)
      );

    }
Special functions: SECTION_BEGIN, _SECTION_END,
_SECTION_NAME, _DEFAULT_NAME,
_PARAM_VALUES explained
(for advanced users only)
These are new functions that are used by the drag-and-drop mechanism. The most
important pair is _SECTION_BEGIN("name") and _SECTION_END().
When you drop the formula onto a chart pane, AmiBroker appends the formula
you have dragged at the end of the existing chart formula and wraps the inserted
code with _SECTION_BEGIN("name") and _SECTION_END() markers:
So, if the original formula looks as follows:
    P = ParamField("Price
    field",-1);

    Periods = Param("Periods", 15, 2, 200, 1, 10 );

    Plot( MA(
    P, Periods ), _DEFAULT_NAME(), ParamColor( "Color",
    colorCycle ), ParamStyle("Style")
    );
it will be transformed by AmiBroker to:
_SECTION_BEGIN("MA");

    P = ParamField("Price
    field",-1);

    Periods = Param("Periods", 15, 2, 200, 1, 10 );

    Plot( MA(
    P, Periods ), _DEFAULT_NAME(), ParamColor( "Color",
    colorCycle ), ParamStyle("Style")
    );

  _SECTION_END();
_SECTION_BEGIN/_SECTION_END markers allow AmiBroker to identify code parts
and modify them later (for example, remove individual sections). In addition
to that, sections provide the way to make sure that parameters having the
same name in many code parts do not interfere with each other. For example, if
you drop two moving averages, the resulting code will look as follows:
_SECTION_BEGIN("MA");

    P = ParamField("Price
    field",-1);

    Periods = Param("Periods", 15, 2, 200, 1, 10 );

    Plot( MA(
    P, Periods ), _DEFAULT_NAME(), ParamColor( "Color",
    colorCycle ), ParamStyle("Style")
    );

    _SECTION_END();


    _SECTION_BEGIN("MA1");

    P = ParamField("Price
    field",-1);

    Periods = Param("Periods", 15, 2, 200, 1, 10 );

    Plot( MA(
    P, Periods ), _DEFAULT_NAME(), ParamColor( "Color",
    colorCycle ), ParamStyle("Style")
    );

    _SECTION_END();
Note that code and parameter names are identical in both parts. Without
sections, parameters with the same name will interfere. But thanks to uniquely
named sections, there is no conflict. This is so because AmiBroker identifies
the parameter using both the section name AND the parameter name, so if section names are
unique, then parameters can be uniquely identified. When dropping an indicator,
AmiBroker automatically checks for already-existing section names and auto-numbers
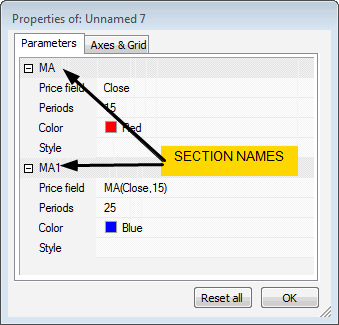
similarly named sections to avoid conflicts. The section name also appears in the
Parameters dialog:
Last but not least, you should NOT remove _SECTION_BEGIN / _SECTION_END
markers from the formula. If you do, AmiBroker will not be able to recognize
sections inside a given formula anymore and parameters with the same name
will interfere with each other.
_SECTION_NAME is a function that just gives the name of the section (given
in the previous _SECTION_BEGIN call).
_DEFAULT_NAME is a function that returns the default name of the plot. The default
name consists of the section name and a comma-separated list of values of numeric
parameters defined in the given section. For example, in the following code:
_SECTION_BEGIN("MA1");

P = ParamField("Price
field");

Periods = Param("Periods", 15, 2, 200, 1, 10 );

Plot( MA(
P, Periods ), _DEFAULT_NAME(), ParamColor( "Color",
colorCycle ), ParamStyle("Style")
);

    _SECTION_END();
_DEFAULT_NAME will evaluate to "MA1(Close,15)".
_PARAM_VALUES works the same as _DEFAULT_NAME except that no section name
is included (so only the list of parameter values is returned). So, in the above
example, _PARAM_VALUES will evaluate to "(Close, 15)".
Frequently Asked Questions about drag-and-drop functionality
Q. What is the difference between Insert and Insert Linked options
in the chart menu?
A. Insert command internally creates a copy of the original
formula file and places such a copy into a hidden drag-and-drop folder, so the original
formula will not be affected by subsequent editing or overlaying other
indicators onto it.
Double-clicking a formula name in the chart tree is equivalent to choosing
the Insert command from the menu. On the other hand, the Insert Linked command
does not create a copy of the formula. Instead, it creates a new chart pane
that
directly
links
to the original
formula. This way, subsequent editing and/or overlaying other indicators
will modify the original formula.
Q. I cannot see buy/sell arrows from my trading system
A. Trade arrows can be displayed on any chart
pane (not only the built-in price chart). However, by default, the arrow display
is turned OFF.
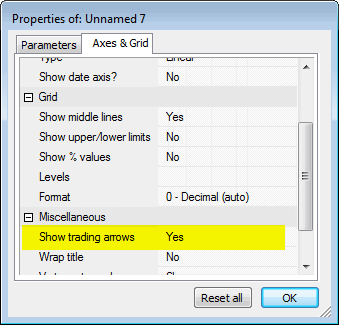
To turn it ON, you have to open the Parameters dialog, switch to "Axes and grid" and
switch the "Show
trading arrows" option to "Yes".
Q. The ReadMe says: "Automatic Analysis formula window is now
drag-and-drop
target too (you can drag formulas and AFL files onto it)". What does it mean?
A. It means that you can drag the formula from either the Chart tree or an .AFL file
from Windows Explorer and drop it onto the Automatic Analysis (AA) formula window
and it will load a formula into the AA window. This is an alternative to loading
a formula via the "Load" button in the AA window.
Q. Can I drop a shortcut onto the formula window?
A: No, you cannot. You can only drag-and-drop files with the .AFL extension (shortcuts
in Windows have the .lnk extension).
Q. Can I add my own formulas to the Chart tree?
A. Yes, you can. Simply save your .AFL formula into the Formulas subfolder of the AmiBroker
directory and it will appear under the "Charts" tree (View->Refresh
All may be needed
to re-read the directory if you are using an external editor).
Q. I have added a new file to the Formulas folder, but it doesn't show up in
the Charts tree unless I restart AmiBroker? Is there a way to refresh the Chart tree?
A. You can refresh the Chart tree by choosing the View->Refresh All menu.
Q. If I modify the formula that ships with AmiBroker, will it be overwritten
by the next upgrade?
A. Yes, it will be overwritten. If you wish to make any modifications to the
formulas provided with AmiBroker, please save your modified versions under a new
name or (better) in your own custom subfolder.
Q. I can see the Reset All button in the Parameters dialog, but it sets all parameters
to their default values. Is there a way to reset a SINGLE parameter?
A. No, there is no such option yet, but it will be added in upcoming betas.
Q. I dragged RSI to the price chart pane and got a straight
red line at the bottom of the pane. What is wrong?
A. When you drop two indicators/plots that have drastically different values,
you have to use style OwnScale for one of them. You can turn on the OwnScale style
using the Parameters dialog.
This
ensures
that
the scales used for each are independent and you can see them properly. Otherwise,
they use
one
common
scale that fits both value ranges, which results in flattened plots.
Q. The light-grey color of the new AFL special functions_SECTION_BEGIN
etc. makes them invisible in my blue-grey background IB color. How
can I change the special functions' color?
A. Right now, you cannot. But there will be a setting for coloring special
functions in the next version.
Q. When I drop the indicator, the Parameters dialog does not show all
parameters.
Is this correct?
A. Yes, it works that way. The idea behind it is simple. When you drop a new
indicator, AmiBroker displays a dialog with parameters ONLY for the currently
dropped indicator. This is to make sure that newly inserted indicator parameters
are clearly visible (on top) and a new user is not overwhelmed by tens of other
parameters referring to previously dropped indicators. On the other hand, when you choose
"Parameters" item from the context menu, then ALL
parameters
will
show
up - allowing you to modify all of them anytime later.


