Issue 8/2000
Issue 8/2000. 31 December 2000.
Copyright (C)2000 Tomasz Janeczko.
All back issues available from:
http://www.amibroker.com/newsletter/
|
Issue 8/2000 |
AmiBroker Tips weekly newsletter. Issue 8/2000. 31 December 2000. Copyright (C)2000 Tomasz Janeczko. All back issues available from: http://www.amibroker.com/newsletter/ |
Welcome to the 8th issue of AmiBroker Tips newsletter. We are just after Christmas
season and I hope you enjoyed family life as I did. Now I want to wish you a
Very Happy and profitable New Year! Also I want to thank for all wishes and
greetings I have received. Since 21st century is right behind the door I want
to thank you again for your generous support and I want to promise you that
AmiBroker will grow so it finally becomes the most comprehensive technical analysis
package available and you will be happy that you invested your hard-earned money
well.
Just a reminder: if you have any comments/suggestions or article ideas, please don't hesitate to drop a line to newsletter@amibroker.com
A new version (3.45) is under development. Highlights of this version are: usability and AFL. In the usability area a brand new ASCII import Wizard is coming featuring easy to use interface for creating you own import definition formats. Also Quick Review and Automatic Analysis windows will allow you to sort output lists by any column by simply clicking on the column's header. Even more - Quick Review is resizable in 3.45. As for AFL lots of new functions are coming including: 3 functions for calculating Random Walk Index, functions for linear regression slope, standard deviation, correlation, Wilders averaging, five new date functions (returning packed date, year, month, day, day of week arrays), very useful HighestSince, HighestSinceBars, LowestSince and LowestSinceBars functions and more... Release 3.45 is scheduled on second half of January 2001.
3 AFL Formula Library: Detecting double tops and bottoms
Detecting patterns is somewhat tricky thing mainly because you can be sure about that only if the pattern is complete. This implies delay in detecting patterns and/or formations and limits usefulness of automatic detection formulas. Anyway I will try to show you how to write pattern recognition formulas using AFL. In this article we will focus on detecting very well known pattern - a double top / double bottom.
The double top is a major reversal pattern that forms after an extended uptrend. As its name implies, the pattern is made up of two consecutive peaks that are roughly equal, with a moderate trough in between. Although there can be variations, the classic double top marks at least an intermediate change, if not long-term change, in trend from bullish to bearish. Many potential double tops can form along the way up, but until key support is broken, a reversal cannot be confirmed. The whole formation consists of the following parts: prior trend, first peak, trough, second peak, decline from the peak, support break and then decline to the price target. The pattern seems straightforward but there are many details to watch out. For the purpose of this article I will use simplified model of double top pattern that consists of double, roughly equal peaks and the decline from the second peak. So, let's begin.
AmiBroker Formula Language provides built in functions for detecting peaks and troughs. These functions are based on Zig( array, thresh ) function which you can test by trying the follwing formula:
graph0 = close;

    graph1= zig( close, 5 );
As you can see Zig() function determines major peaks and troughs using percentage threshold given as a second parameter. The bigger threshold you specify the more significant peaks and troughs are detected. The line generated by Zig() function indentifies the main trend. There is one caveat however: please take special attention using Zig() function in trading systems because it looks in the future so you will get unrealistic system test results. Zig() function and all function using it (Peak, Trough, PeakBars, TroughBars) are intended for pattern recognition formulas only.
We will start wrting the formula for detecting double top pattern with detecting peaks:
percdiff = 10; /* this defines percentage threshold for detecting peaks
    */

    PK = Peak( H, percdiff, 1 ) == HIGH;
Now PK array will hold "1" for all bars when peaks occur and "0" elsewhere because high price is equal to the peak value only on the day when this peak occurs.
Now we want to know if two subsequent peaks are more or less the same:
peakdiff = ValueWhen( PK, H, 1 )/ValueWhen( PK, H, 2 );
The peakdiff variable holds now the high price of the most recent peak divided by the high price of the second recent peak. Ideally this value should be 1 - peaks are exactly the same but we will allow slight differences. Let's say we allow the difference of one fourth of the percentage threshold used for detecting peaks:
validdiff = percdiff/400;

    doubletop = PK AND abs( peakdiff - 1 ) < validdiff;
Now doubletop variable is "1" if double peak occurred and the difference between the peaks is less than one fourth of the threshold. In our example the threshold in 10% and validdiff is 0.025 (2.5%).
Everything is fine but soon you find out that this formula is not too good. It detects double tops much too often especially tops that are located to close. For that reason we will add a check for distance between peaks:
percdiff = 10;

    validdiff = percdiff/400;

    mindistance = 10;
PK= Peak( H, percdiff, 1 ) == HIGH;
x = Cum( 1 );

    XPK1 = ValueWhen( PK, x, 1 );

    XPK2 = ValueWhen( PK, x, 2 );
peakdiff = ValueWhen( PK, H, 1 )/ValueWhen( PK, H, 2 );

    doubletop = PK AND abs( peakdiff - 1 ) < validdiff AND (XPK1 - XPK2)>
    mindistance;
The mindistance variable defines minimum number of bars between peaks needed for valid double top formation. XPK1 and XPK2 variables hold the bar number of the first and the second peak.
Now our formula does not detect peaks located to close but still generates too much signals because it does not check for the validity of the second peak. It just assumes too soon that the peak is valid. To be more sure we need to wait for some days to find out that the second peak is important. One idea is just to check for a couple of days if the price does not return above the level of the peak. So our formula now will look like this:
percdiff = 10; /* peak detection threshold */

    validdiff = percdiff/400;

    fwdcheck = 4; /* how many days forward to check for valid second peak*/
mindistance = 10;
PK= Peak( H, percdiff, 1 ) == HIGH;
x = Cum( 1 );

    XPK1 = ValueWhen( PK, x, 1 );

    XPK2 = ValueWhen( PK, x, 2 );
peakdiff = ValueWhen( PK, H, 1 )/ValueWhen( PK, H, 2 );

    doubletop = PK AND abs( peakdiff - 1 ) < validdiff

    AND (XPK1 - XPK2) > mindistance

    AND HIGH > HHV( Ref( H, fwdcheck ), fwdcheck - 1 );
Note that this formula now references the future ( look at the following statement: Ref( H, fwdcheck ) ) - this means that it will not generate ANY signals until fwdcheck bars pass after the second peak. So, for example, if double top pattern has occured on Monday you will know about that on Friday because four days (future quotes) are needed to confirm the pattern.
Now our formula for detecting double tops is much better, but still is missing
one imporant point - detecting prior trend. That is why it sometimes generates
false signals. I will not, however, go any further in this article just to keep
things simple. You can use the double top formula in Automatic analysis/Scan
function for screening the stocks for potential reversal patterns or in Commentary.
By adding buy=doubletop; sell=0; statement to the formula you will
be able to screen stocks for the potential reversal patterns and see the arrows
when the formula is used in Commentary window. A ready to use version of the
double top formula is available from AFL
on-line library.
4 Tip of the week: Setting up profile view
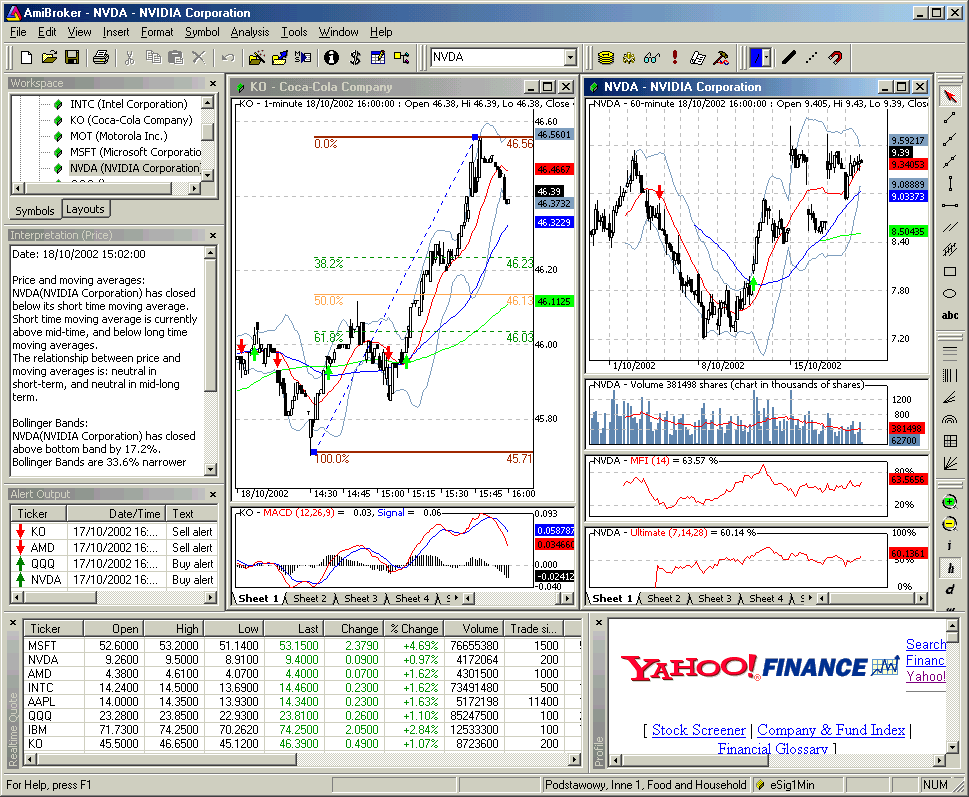
AmiBroker has an embedded web browser allowing you to display company profiles from both local files and remote web pages providing appropriate information. The profiles are available from View->Profile menu and the toolbar. The example DJIA database supplied with AmiBroker is set up so profile view displays the Yahoo Finance's profile web page for currently selected ticker. If you have for example selected 'KO' (Coca Cola Company) the http://biz.yahoo.com/p/K/KO.html profile web page will be displayed as shown in the picture below:

If you want to use this feature for non-US markets additional steps are necessary to direct AmiBroker to appropriate page. This article will describe how to do that.
4.1 Setting Profile URLs in Categories
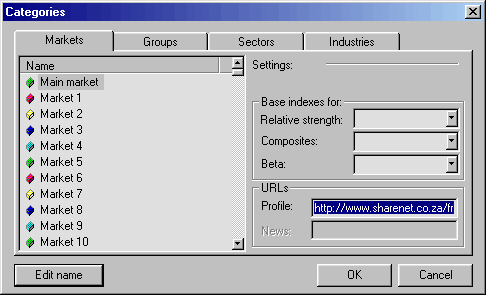
Please go to the Stock->Categories menu. After choosing this option you will see the window like this:

Please take a look at URLs - Profile edit box. Here you can enter the URL-template for viewing on-line (or off-line) company's profiles. These URL-templates are market-based, which means you can have different templates for each market. The template is then parsed to make actual URL to the web page. For example to see Yahoo's profiles page you can use following URL template:
http://biz.yahoo.com/p/{t0}/{t}.html.
Symbols enclosed in brackets {} define fields which are evaluated in execution time. {t0} symbol is evaluated to the first character of the ticker name and {t} is evaluated to the whole ticker name. So if AAPL is selected AmiBroker will generate following URL from above template:
http://biz.yahoo.com/p/a/aapl.html
Then AmiBroker uses built-in web browser to display the contents of the page.
4.2 Special fields encoding scheme
As shown in above example template URL can contain special fields which are substituted at run time by values corresponding to the currently selected stock. The format of the special field is {x} where x is describes field type. Currently there are three allowable field types: ticker {t}, alias {a}, web id {i}. You can specify those fields anywhere within the URL and AmiBroker will replace them with appropriate values entered in the Information window. You can also reference to single characters of ticker, alias or web id. This is useful when given web site uses first characters of, for example, ticker to group the html files (Yahoo Finance site does that), so you have files for tickers beginning with 'a' stored in subdirectory 'a'. To reference to single character of the field use second format style {xn} where x is field type described above and n is zero-based index of the character. So {a0} will evaluate to the first character of the alias string. To get first two characters of a ticker write simply {t0}{t1}. Note about web id field: this new field in Information window was added to handle situations when web sites do not use ticker names for storing profile files. I found some sites that use their own numbering system so they assign unique number to each stock. AmiBroker allows you to use this nonstandard coding for viewing profiles. All you have to do is to enter correct IDs in Web ID field and use appropriate template URL with {i} keyword.
4.3 Profiles stored locally
You may want to have all profiles stored on your local hard disk. This has an advantage that profiles are accessible instantly but they can take significant amount of storage space and you will need to update them from time to time. To access locally stored files use the following template URL (example, C: denotes drive): file://C:\the_folder_with_profile_files\{t}.html. You are not limited to HTML files, you can use simple TXT files instead. Then create (or download) the .html (or txt) files for each stock in the portfolio. These files should obey the following naming convention: <ticker>.html. So for example for APPLE (ticker AAPL) the profile should have the name AAPL.html (or AAPL.txt)
4.4 Web-based profiles
If you want to display the profiles from remote web pages you will need to find out how they are accessible (the URL to the web page) and how the data for different stocks are accessible. I will describe the problem on the example of Sharenet (www.sharenet.co.za) site providing the data for companies listed on Johannesburg Stock Exchanges. Sharenet provides company information that is accessible at the following address (URL):
http://www.sharenet.co.za/free/free_company_na.phtml?code=JSECODE&scheme=default
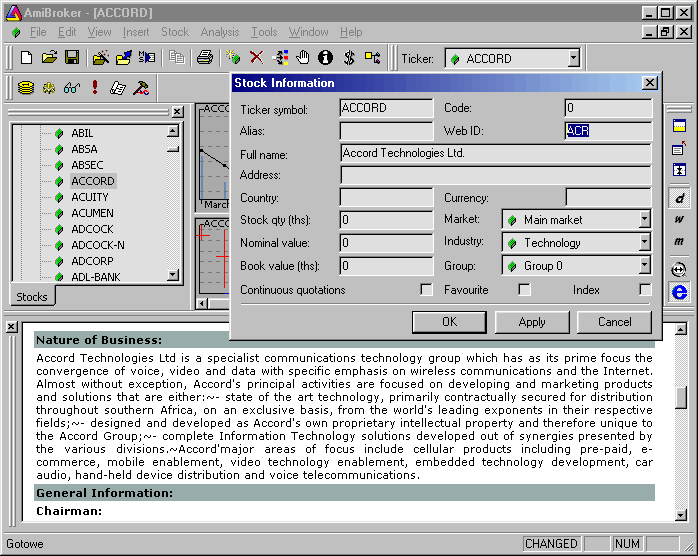
The problem is that database provided by Sharenet uses long ticker names and JSECODE is a short stock code. For example for "Accord Technologies" company the ticker in Sharenet database is ACCORD but the code is ACR. To solve the problem we will need to use Web ID field in the Stock Information window. If you have Sharenet database just choose the ACCORD from the ticker list, open Stock->Information window and enter ACR to the Web ID edit box and click OK. Then please open Stock->Categories window and enter the following URL template to the Profile URL edit box:
http://www.sharenet.co.za/free/free_company_na.phtml?code={i}&scheme=default
To be 100% sure please select the text above with a mouse. Then copy it to the clipboard (Edit->Copy, CTRL-C). Then switch to AmiBroker and click on the Profile URL edit box. Delete everything from it and press CTRL-V (this will paste the text).
Please note that we have used {i} special field in the template that will be replaced by AmiBroker with the text entered in the Web ID field of the stock information window. Now please select View->Profile and you should see the following:

Now when profile view for ACCORD is working correcly all you have to do is to enter JSE short codes to the WebID field of Stock information window to enable profiles for all other stocks. It is easy to say but much harder to do - with thousands of stocks it is very time consuming work...but this task can be automated completely by using scripting and AmiBroker's OLE automation interface. The only thing needed is a text file with ticker and JSE code pairs. I will ask Sharenet for that kind of file and then the whole task would be much easier. Nevertheless, I hope that I explained the steps needed to setup your profile view and you will be able to do that for your local exchanges.
.... and that's all for this week - hope you enjoyed reading
AmiBroker Tips weekly newsletter. Issue 8/2000. Copyright (C)2000 Tomasz Janeczko. All back issues available from: http://www.amibroker.com/newsletter/