Charts and drawing tools
AmiBroker features all standard chart styles and drawing tools. They all can be customized, combined and overlaid anyway you want. Hundreds of popular indicators like MACD, RSI, Stochastics, ADX/DMI and many more are included
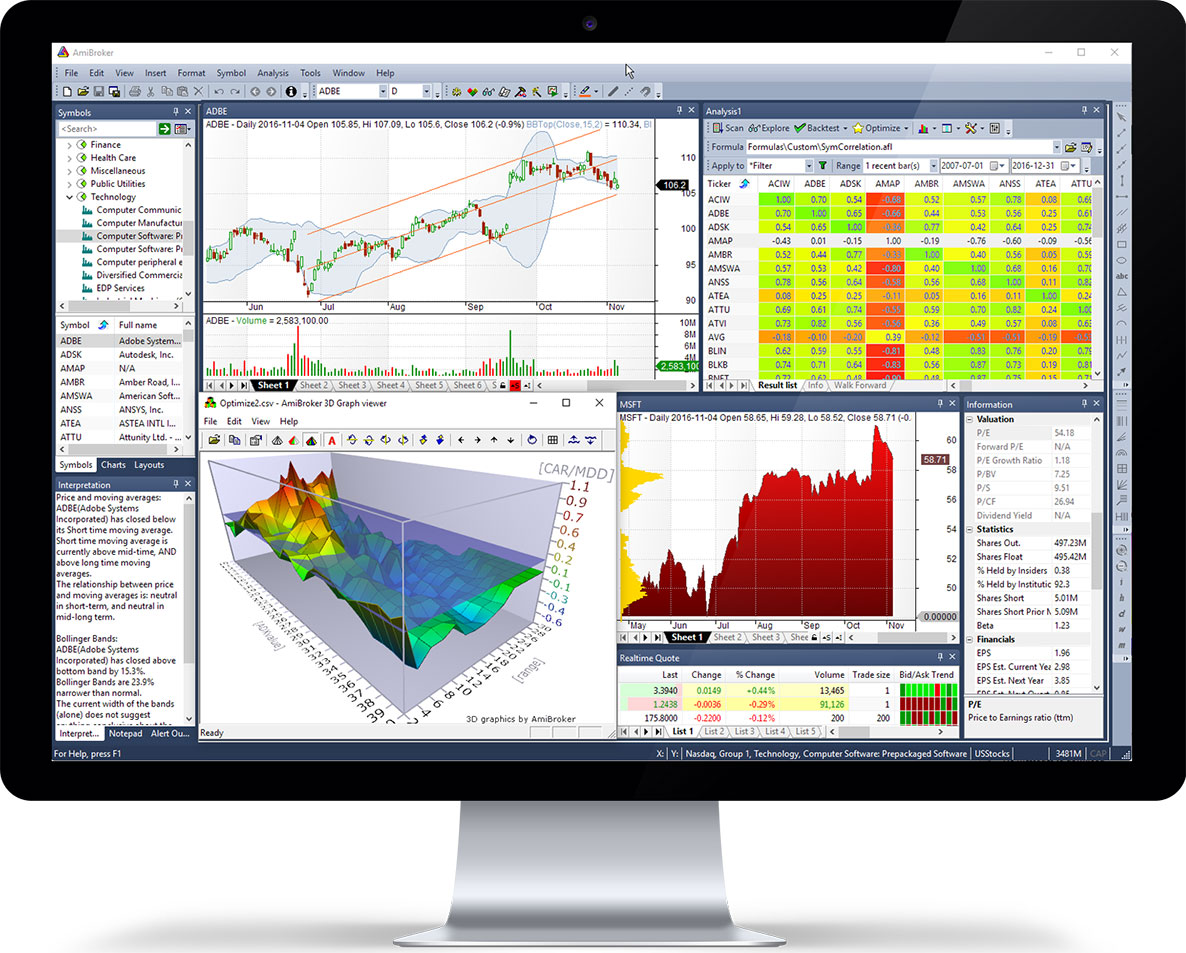
3D optimization chart
It helps finding out parameter combinations that produce best and most reliable results. 3D chart can be rotated, animated and watched from any angle. A water level can be adjusted to precisely determine peak and valleys above and under certain level
Analysis window
In this example it shows cross-correlation between symbols from user-defined list.
This is just one of many things that you can do using Exploration.
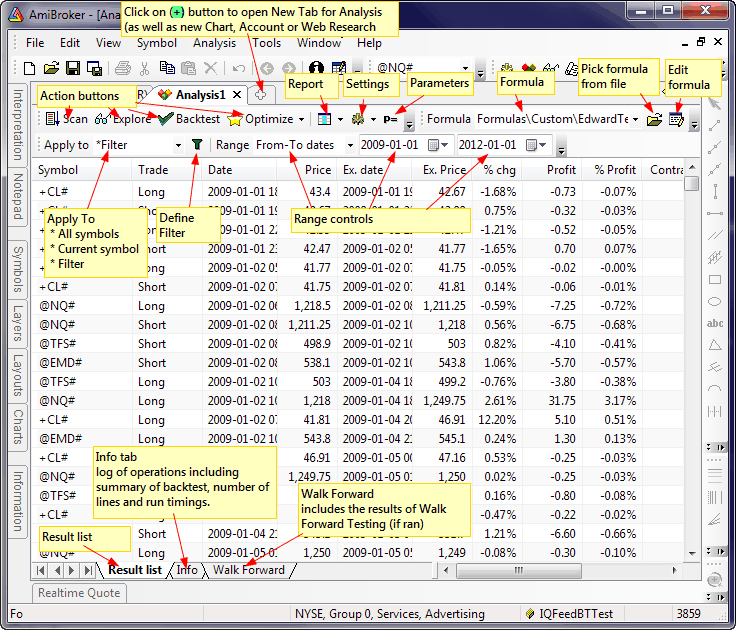
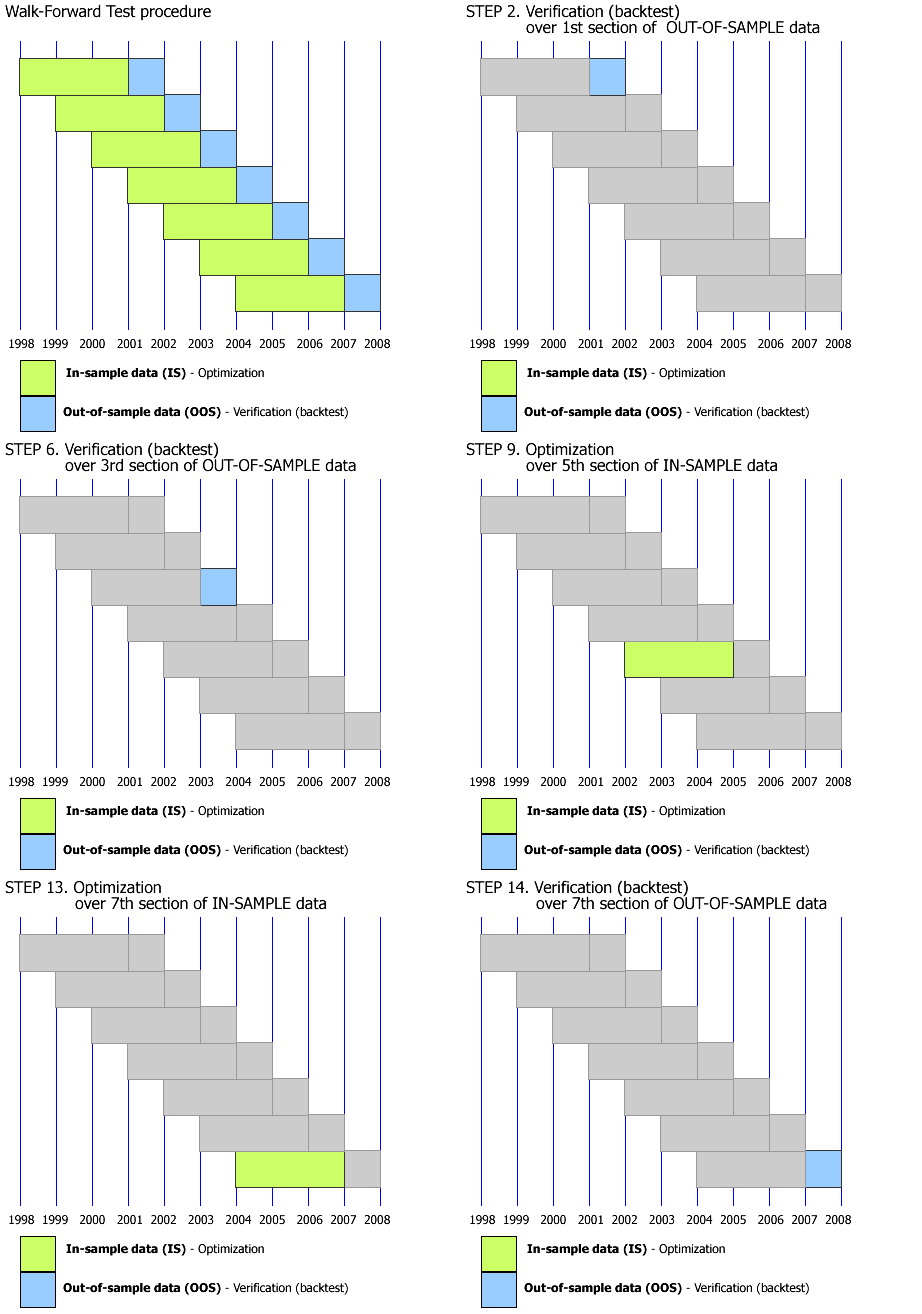
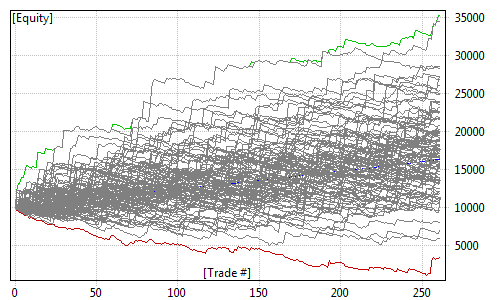
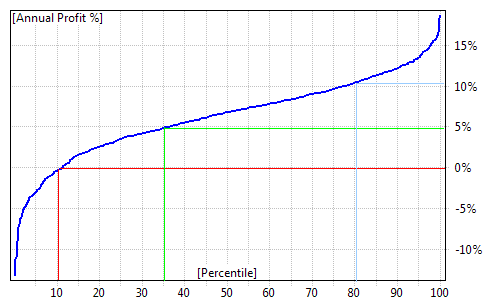
The Analysis window is home to backtesting, optimization, walk-forward testing and Monte Carlo simulation
Symbols window
AmiBroker allows you to categorize symbols into different markets, groups, sectors, industries, watch lists. Ultra-quick full-text search makes finding symbols a breeze. Categories are used in all other areas of the program to quickly filter/analyze user-definable selections of symbols
Interpretation window
The interpretation is automatically generated market commentary based on user-definable formulas. You can use pre-written interpretations or create your own
Gradient chart and market profile
Any chart, not only price, can be displayed as gradient chart for attractive look. On the left side you can see volume-at-price chart (orange) which allows to quickly recognize price levels with highest traded volume
Real time quote
This small fragment of Real-Time quote window features mini High-Low rank charts and Bid/Ask trend indicators which helps tape reading
Information window
AmiBroker provides instant access to fundamental & valuations data. Fundamental data can also be used in your formulas
Flexible user interface can be arranged and customized in any way you like. Multiple monitor setups are fully supported. Windows can be docked or floated.


