Creating your own indicators
There are two ways to create your own indicators:
1) Using a drag-and-drop interface
2) By writing your own formula
The first method, using a drag-and-drop interface, is very simple and does not require
writing a single line of code. To learn more about drag-and-drop indicator creation,
please check Tutorial: How to use drag-and-drop charting interface
The second method involves writing an indicator formula in flexible AFL (AmiBroker
Formula Language). You can
find
a description
of
this language
in the AFL Reference Guide section of the user's guide.
Here we will present the basic steps needed to define and display your own custom
indicator. In this example, we
will
define an "indicator" that will show a line volume graph (opposite
to the built-in bar volume graph).
Just follow these steps:
- Select the Analysis->Formula Editor option from the menu as shown
below:
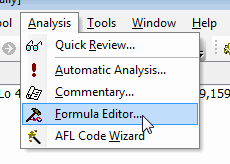
- You will see the following dialog displayed on the screen:
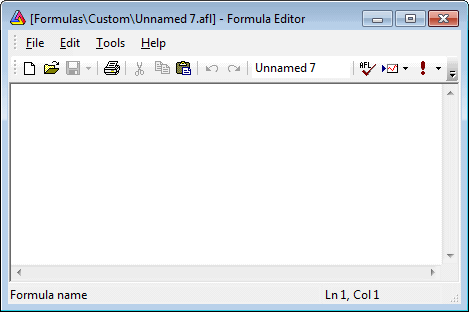
It presents an empty Formula Editor window.
- Now single-click in the edit field located in the editor toolbar to change
the name of the indicator:
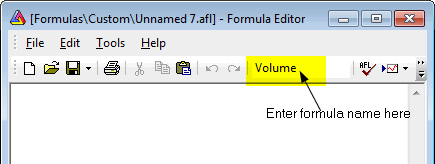
Now you can edit the name of the custom indicator. Give it the name "My
own indicator". After you press the ENTER key, the caption will be updated
with the new file name as shown below:
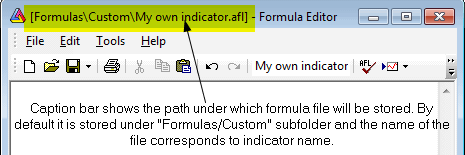
- Now type the formula:
Plot( Volume, "My
    volume chart", colorGreen );
This formula instructs AmiBroker to plot the built-in Volume array. The second parameter
specifies the title of the plot, and the third parameter defines the color. The
picture below shows the formula editor after entering the code:
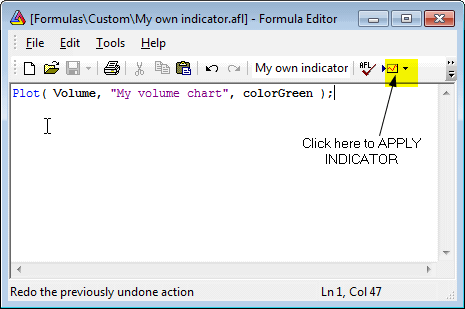
- Now click the "Apply indicator" toolbar button (or choose the Tools->Apply
indicator menu option) as shown in the picture, and close the editor by pressing
the "X" button in the upper right corner of the editor window.
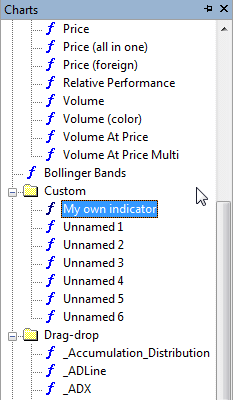
Now the indicator you have just written is displayed as a chart. You can also
find it stored as a formula in the Chart tree:
Now you can improve your indicator by adding Param functions so that both the color
and style of the plot can be modified using the Parameters dialog.
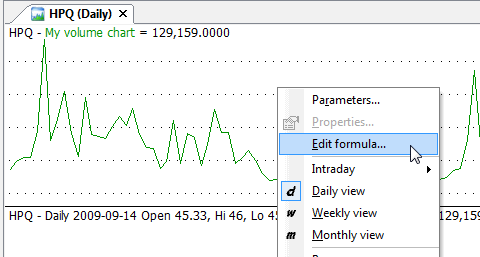
To do so, click with the RIGHT mouse button over the chart pane and select "Edit
Formula" (or press Ctrl+E)
And modify the formula to:
Plot( Volume, "My
      volume chart", ParamColor("Color", colorGreen ), ParamStyle("Style", 0,
maskAll ) );
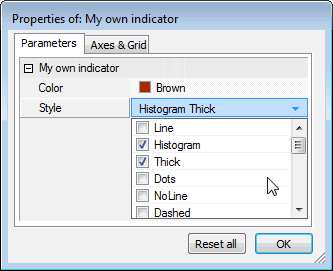
Then press "Apply indicator" to apply the changes. Now click
with the RIGHT mouse button over the chart pane again and select "Parameters" (or
press Ctrl+R), and you will see the Parameters dialog allowing you to modify colors
and styles used to plot a chart:
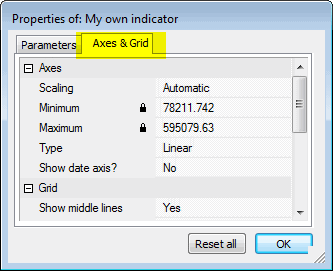
Also, in the "Axes & Grid" tab, you will be able to change settings for axes,
grids, and other charting options referring to this particular chart:
For further information on creating your indicators, please check the Using
graph styles and colors tutorial section.
For further reference on using the Formula Editor, please consult the "Environment
- Formula Editor" and "AmiBroker Formula Language - AFL Tools" sections
of the AmiBroker User's guide and using the AFL editor.


