September 29, 2014
Debugging techniques – Part 1 – Exploration
From time to time people send us their formulas asking what happens in their own code. Or they do not know why given trade is taken or not. These questions are usually caused by the fact that people lack the insight what is happening inside and what values values their variables hold.
The first general-purpose debugging technique is using Exploration.
You need to add several AddColumn statements and run your code as Exploration, so you can actually see the values of all variables. This will reveal whenever you really have values that you expect and would make it easier for you to understand what is happening inside your code.
In simplest form add this code to your system formula:
Filter = 1; // show all bars
AddColumn( Buy, "Buy" )
and it will show you if you are getting expected values in Buy array. You can use the same technique to track the content of any variable. Add as many columns as you want. You would be surprised how much insight into your own code you will get.
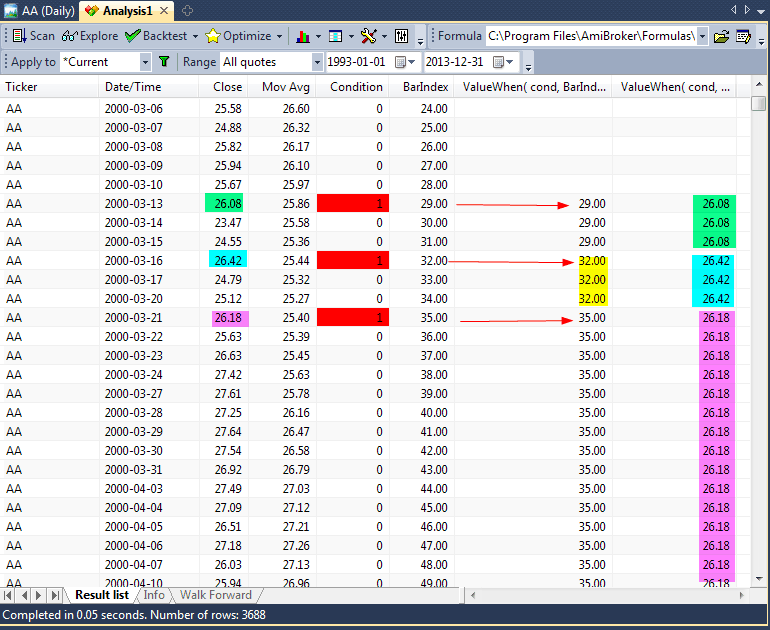
You can use Exploration to learn how particular function works, for example, if you don’t understand how ValueWhen works, you can display its results this way:
Filter = 1; // show all bars
//
m = MA( C, 10 );
cond = Cross( C, m );
bi = BarIndex();
//
AddColumn( C, "Close" );
AddColumn( m, "Mov Avg" );
AddColumn( cond, "Condition");
AddColumn( bi, "BarIndex" );
AddColumn( ValueWhen( cond, bi ), "ValueWhen( cond, BarIndex() )" );
AddColumn( ValueWhen( cond, Close), "ValueWhen( cond, Close )" )
If you run above code you will clearly see how ValueWhen picks the value when condition is true and “holds” it for all other bars (when condition is false).

Once you get this level of insight into your code you will be better equipped to fix any errors.
Exploration is number one choice in getting detailed view on what is happening inside your code.
For more information about Exploration see http://www.amibroker.com/guide/h_exploration.html
 Filed by Tomasz Janeczko at 4:03 am under Exploration
Comments Off on Debugging techniques – Part 1 – Exploration