January 30, 2016
Separate ranks for categories that can be used in backtesting
When we want to develop a trading system, which enters only N top-scored symbols from each of the sectors, industries or other sub-groups of symbols ranked separately, we should build appropriate ranks for each of such categories. This can be done with ranking functionalities provided by StaticVarGenerateRanks function.
The formula presented below iterates though the list of symbols included in the test, then calculates the scores used for ranking and writes them into static variables. The static variables names are based on category number (sectors in this example) and that allows to create separate ranks for each sector.
// watchlist should contain all symbols included in the test
wlnum = GetOption( "FilterIncludeWatchlist" );
List = CategoryGetSymbols( categoryWatchlist, wlnum ) ;
if( Status( "stocknum" ) == 0 )
{
// cleanup variables created in previous runs (if any)
StaticVarRemove( "rank*" );
StaticVarRemove( "values*" );
categoryList = ",";
for( n = 0; ( Symbol = StrExtract( List, n ) ) != ""; n++ )
{
SetForeign( symbol );
// use sectors for ranking
category = sectorID();
// add sector to the list
if( ! StrFind( categoryList, "," + category + "," ) ) categoryList += NumToStr( category, 1, 0 ) + ",";
// write our ranking criteria to a variable
// in this example we will use 10-bar rate-of-change
values = Roc( Close, 10 );
RestorePriceArrays();
// write ranked values to a static variable
StaticVarSet( "values" + category + "_" + symbol, values );
}
// generate separate ranks for each category from the list
for( i = 1; ( category = StrExtract( categoryList, i ) ) != ""; i++ )
{
StaticVarGenerateRanks( "rank", "values" + category + "_", 0, 1224 );
}
}
category = sectorID();
symbol = Name();
m = Month();
values = StaticVarGet( "values" + category + "_" + symbol );
rank = StaticVarGet( "rank" + "values" + category + "_" + symbol );
// exploration code for verification
AddColumn( values, "values" );
AddColumn( rank, "rank" );
AddTextColumn( SectorID( 1 ), "Sector" );
AddColumn( SectorID(), "Sector No", 1 );
Filter = rank <= 2;
if( Status( "Action" ) == actionExplore ) SetSortColumns( 2, 5, 4 );
// sample backtesting rules
SetBacktestMode( backtestRotational );
score = IIf( rank <= 2, values, 0 );
// switch symbols at the beginning of the month only
PositionScore = IIf( m != Ref( m, -1 ), score, scoreNoRotate );
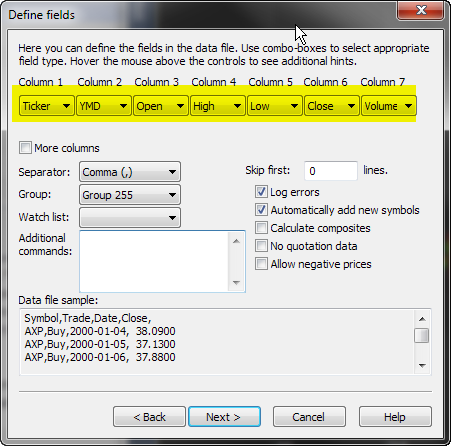
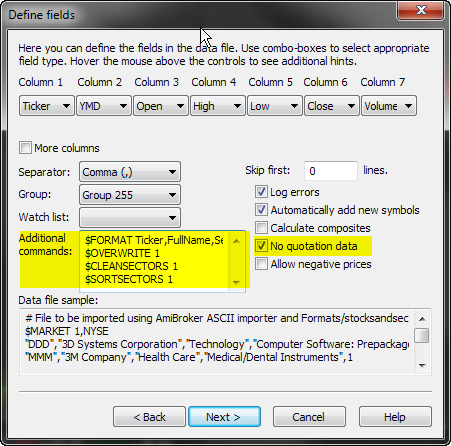
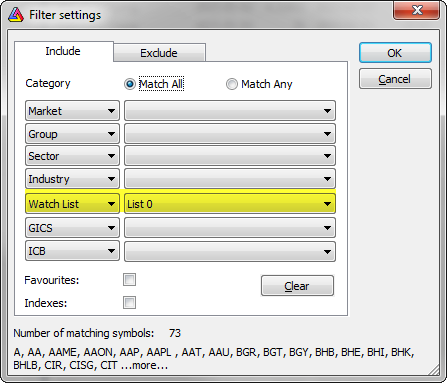
SetPositionSize( 1, spsPercentOfEquity )Our test should be applied to a watchlist, which contains all symbols we want to include in our ranking code:
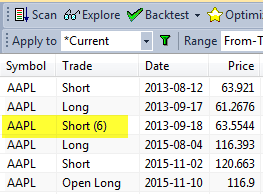
Running the exploration will show two top-ranked symbols for each of the sectors:
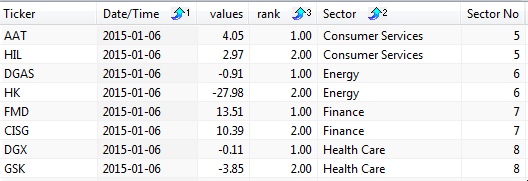
We can also change Filter variable definition to
Filter = 1and show all ranked symbols instead.
Such ranking information can be used in backtest and sample rules included at the end of the code use rank information to allow only two top-scored symbols to be traded.
 Filed by Tomasz Janeczko at 1:22 am under General
Comments Off on Separate ranks for categories that can be used in backtesting