January 14, 2015
Drawing line extensions on future bars using AFL
AmiBroker allows to display the AFL-based chart output on the future blank bars area with use of XSHIFT argument of the Plot function. This functionality allows to move the particular chart by certain number of bars and place the output within the blank bars area (provided that we use positive value for XSHIFT, i.e. we are shifting the chart to the right).
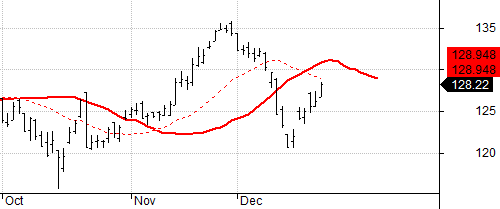
The following code shows price chart with 20-period MA overlay and additionally – with the same 20-period MA shifted to the right.
Plot( Close, "Close", colorDefault, styleBar );

Plot( MA( Close, 20 ), "MA-20", colorRed, styledashed );
Plot( MA( Close, 20 ), "MA-shift", colorRed, styleThick, Null, Null, 10)
However – there may be some situations where we not only want to shift the chart position, but actually calculate the position of the line on the blank bars, for example if we are producing an extension of the existing indicator line.
Let us consider a simple example, which draws a line connecting the last record of the input array with the value 50-bars ago, using LineArray() function.
The code is the following:
inputArray = Close;
Plot( inputArray, "input", colorDefault, styleDots );

bi = BarIndex();
lvbi = LastValue( bi );
x0 = lvbi - 50;
x1 = lvbi;
y0 = inputArray[ lvbi - 50 ];
y1 = inputArray[ lvbi ];

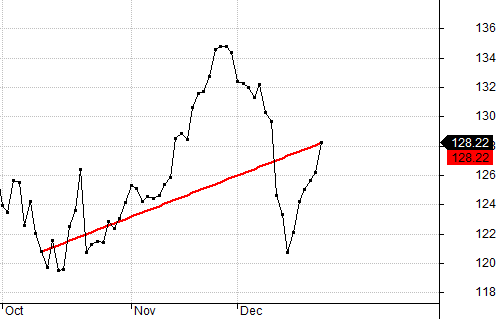
Plot( LineArray( x0, y0, x1, y1, True , True ), "line", colorRed, styleThick )
and the output looks like this:
LineArray function allows to calculate the extension automatically if we set EXTEND argument to True, however – all the calculations in AFL language are performed within the ‘real bars’ area, i.e. on the available elements of the array, between array item 0 until array item (Barcount-1).
To calculate and display the values that extend past the very last bar available in the array we will use technique explained below:
- first we shift the input back (to the left) by N bars, so the real input data would occupy earlier part of the array and we would have extra bars at the end for the calculation of extended arrays
- now we calculate the position of arrays on such shifted
- shift the displayed output forwards with XSHIFT functionality of Plot function (so the calculated extensions would get aligned onto the blank bars as a result).
If our original input array contains 200 bars and the line was drawn between bar 150 and the bar 200, then our aim is to shift the array that way, so the line would occupy the bars between bar 140 and bar 190, while the remaining 10 bars at the end of the array could be used for calculating the extended part of the line. Then – using XSHIFT we could place the array back into its original position.
inputArray = Close;
Plot( inputArray, "input", colorDefault, styleDots );

// here we shift the input array to the left
shift = 10;
inputArray = Ref( inputArray, shift );

// calculations of the x-y coordinates of the LineArray
// take into account the fact that array has been shifted
bi = BarIndex();
lvbi = LastValue( bi );
x0 = lvbi - 50 - shift;
x1 = lvbi - shift;
y0 = inputArray[ lvbi - 50 - shift ];
y1 = inputArray[ lvbi - shift ];

// lineArray shifted back to original (correct) position with XSHIFT
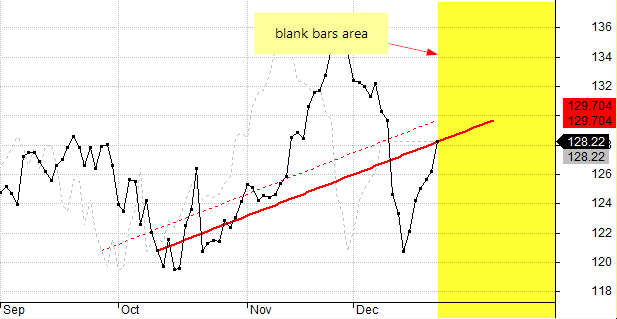
Plot( LineArray( x0, y0, x1, y1, True, True ), "line", colorRed, styleThick, Null, Null, shift );

//positions that were used for calclations before using xshift
Plot( inputArray, "input shifted", colorLightGrey, styleDashed );
Plot( LineArray( x0, y0, x1, y1, True, True ), "line shifted", colorRed, styleDashed )
Dashed lines in the above chart show the shifted positions of the input array and calculated LineArray before using XSHIFT (i.e. on the bars that were used for actual calculations)
 Filed by Tomasz Janeczko at 4:45 pm under Charting
Comments Off on Drawing line extensions on future bars using AFL