amibroker

HomeKnowledge Base

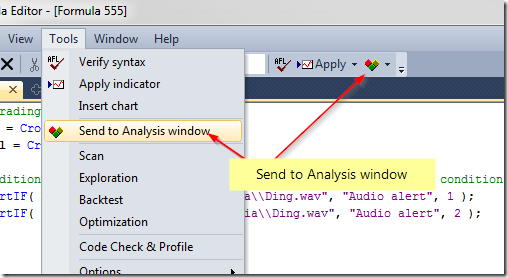
Detecting N-th occurrence of a condition using modulus operator

Modulus (%) is an operator that returns the reminder from integer division. It is very helpful to create counters that wrap-around at user-specified N.

In order to define a condition, which returns True every Nth bar, the easiest way is just to use % (modulus) operator. If we apply modulus to consecutive numbers such as BarIndex() – then calculating the reminder from integer division of barindex by N will return 0 every Nth bar (on bars that are divisible by N). We can use the following exploration to demonstrate that:

7;
bi BarIndex();
condition bi == 0;

Filter 1;
AddColumnbi"BarIndex");
AddColumnbi "Div by 7 remainder ");
AddColumnIIFcondition'T''F' ), "Condition",
           
formatCharcolorDefaultIIfconditioncolorYellowcolorDefault ) )

Modulus 1

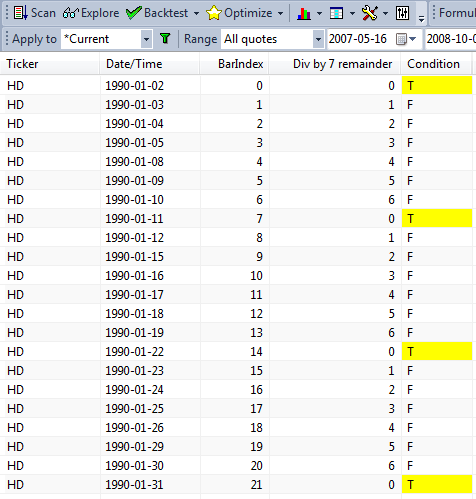
Since the remainder from division by 7 will equal zero only for the multiples of 7, then we will have our condition True every 7th bar (as marked in the above exploration results with T letter on yellow background).

Using the same technique we can also count occurrences of certain criteria and then apply the % operator. For example – let us say we want to test a rotational strategy, where we rotate our portfolio every 2nd Monday. To detect such condition in our code we need to first identify all Monday bars, then count them and use % operator to divide such count by 2.

The following exploration shows the calculations of the condition we look for:

Filter 1;
AddColumnDayOfWeek(), "Day of week");
AddColumnMon"Monday");
AddColumncountMon"Monday counter");
AddColumncountMon == 0"division by 2 remainder");
AddColumnrotation"condition"1colorDefaultIIfrotationcolorYellowcolorDefault) )

Modulus 2

Here is the formula showing how to code these technique for the rotational back-test:

SetBacktestModebacktestRotational );
posScore 100 RSI(); // sample scoring indicator
SetPositionSize10spsShares ); // sample position sizing

Mon DayOfWeek() == 1// identify Mondays
countMon CumMon ); // count Mondays

// rotate only on Monday, every 2nd one
rotation Mon AND (countMon == );
PositionScore IIfrotationposScorescoreNoRotate )

Text output in Explorations

Explorations allow to display not only numerical data but also text, there are however certain restrictions what can and can’t be displayed in the exploration result list as a text.

AddTextColumn() function allows to display strings, so we can use it for displaying e.g. full name of the symbol or category assignment information:

Filter 1;
AddTextColumnFullName(), "FullName");
AddTextColumnSectorID(1), "Sector");
AddTextColumnIndustryID(1), "Industry");
AddColumnClose"Close")

Exploration Text output

It is worthwhile to note that these strings displayed above do not vary across historical bars. That is important, because there is no such structure in AFL as an ‘array of strings’, therefore an attempt to generate a text, which varies on each bar will not work. Instead a string representing selected array value (or last value) will be displayed.

Let us check such a formula to illustrate the above statement:

condition Close Open;

Filter 1;
AddColumnOpen"Open" );
AddColumnClose"Close" );
AddColumncondition"Condition"1.0);

// WriteIf returns a SINGLE STRING representing condition at last bar of selected range
text WriteIfcondition"Close above Open""Close below Open" );
// the text variable represents value AT THE LAST BAR of selected range
AddTextColumntext"text" )

If we look at the output over more than one bar, then we can see that the condition from the last bar determines the text output in the column:

Exploration Text output

Therefore, such approach as above can only be used in situations where we run the exploration applied e.g. to 1-Recent bar, because it’s the last bar from the range which determines the text displayed in the column in such situation.

If you want to display the value for other bars than last bar of selected range, you need an extra column, like this:

condition Close Open;

Filter 1;
AddColumnOpen"Open" );
AddColumnClose"Close" );
AddColumncondition"Condition"1.0);

// WriteIf returns a SINGLE STRING representing condition at last bar of selected range
text WriteIfcondition"Close above Open""Close below Open" );
AddTextColumntext"Last bar text" ); 

// Note that we are now using Ref() function to reference previous bar data
text2 WriteIfRefcondition, -), "Close above Open""Close below Open" );
AddTextColumntext2"Previous bar text" )

You can use functions like Ref() or ValueWhen() to refer to other bar’s data, or you can use array subscript operator like this condition[ 1 ] to get value of condition at bar with index 1.

There is an alternative method to display values that change on bar by bar basis as letters though. Instead of displaying full string we can display single characters in a column using formatChar parameter, as shown in the code below:

Version5.90 ); // only works for version 5.90 and above
Buy CrossMACD(), Signal() );
Sell CrossSignal(), MACD() );

Filter Buy OR Sell;
AddColumnIIfBuy'B''S' ), "Signal"formatChar )

Exploration Text output

Note: If you are using version older than 5.90, you need to use Asc function instead of single-character literals, as shown below:

Buy Cross(MACD(),Signal());
Sell Cross(Signal(),MACD());

Filter Buy OR Sell;
AddColumnIIfBuyAsc("B"), Asc("S")), "Signal"formatChar )

More information about explorations can be found in the manual:
http://www.amibroker.com/guide/h_exploration.html

How to display correlation between symbols

For the purpose of calculating the correlation between two data-arrays, there is a Correlation() function in AFL which can be used.

In order to display a correlation chart, please select Analysis–>Formula Editor menu and enter the following code:

SetChartOptions0chartShowArrows|chartShowDates);
Ticker ParamStr"Symbol"Name() );
range Param"Periods"25225001);

corr CorrelationCloseForeignTicker"C"), range );
Plotcorr"Correlation " Name() + "/" ticker,
      
ParamColor"Color"colorRed ), ParamStyle"Style"styleLine ) );

// check if different symbols are used
if( ticker == Name() )
    
Title "Please select different symbol from Parameter dialog"

Now select Tools->Apply Indicator. Initially the code will pick the selected symbol’s Close prices for both arrays, so we either need to change the selected ticker in the chart or the second symbol, which can be defined in Parameters dialog.

We can also use Exploration feature to display a correlation matrix e.g. for the watchlist members. The below example shows the process for Watchlist 0 members.

The formula to display correlation table looks as follows:
// read the list of symbols from Watchlist 0
symlist CategoryGetSymbolscategoryWatchlist);

// display only last bar from the Analysis range
Filter Status"lastbarinrange" );

// iterate through symbols
for ( 0; ( sym StrExtractsymlist) ) != ""i++ )
{
    
// calculate correlation over 252 bars
    
Corr CorrelationCForeignsym"C" ), 252 );

    
// set color dynamically based on correlation values
    // and display the output in exploration column
    
Clr 32 SelectedValueCorr ) * 32;
    
AddColumnCorrsym1.2,
               
ColorHSB128 Clr255255 ),
               
ColorHSBClr255255 ) );
}

SetSortColumns)

To use the formula we need to do the following:

  1. assign some symbols to watchlist 0
  2. select Analysis->Formula Editor menu
  3. in the AFL Editor enter the code listed above
  4. select Tools->Send to Analysis menu
  5. in the Analysis window, select Apply to: Filter (in Include tab hit Clear and pick watchlist 0)

    Filter dialog

  6. select Range: 1 Recent bar (in case of longer range, last bar of the range will be used for output)
  7. press Explore button

Here is a sample output table:

Correlation Matrix

Be careful and try not to put 10000 items in the watch list because it would need to create a table with 10K columns. Windows has some limits on pixel width of the list view and it would truncate display when the display width (scrollable area inside list) exceeds 32767 pixels. That makes it practical only to display matrices of not more than about 1000-2000 columns.

How to export quotes to separate text files per symbol

The following KB article: http://www.amibroker.com/kb/2006/03/04/how-to-export-quotations-from-amibroker-to-csv-file/ already explained how to use exploration to export quotes into a single text / CSV file.

If, for some reason, we need individual files for each symbol, AmiBroker offers another way of writing data to text files. This can be achieved by using fputs function that would write directly to external files. Using fputs allows us also to fully control formatting of the output data and file naming can be dynamically set based on Name() function output.

To perform the export procedure, we need to run a Scan over the list of symbols we want to export data for.

In the Analysis->Formula Editor please enter the following code:

// create folder for exporting purposes
fmkdir"C:\\DataExport\\" );

// open file for writing
// file name depends on currently processed ticker
fh fopen"c:\\DataExport\\" Name() + ".txt""w" );

// proceed if file handle is correct
if ( fh )
{
    
dt DateTime();

    
// write header line
    
fputs"Ticker,Date/Time,Open,High,Low,Close,Volume\n"fh );

    
// iterate through all the bars

    
for ( 0BarCounti++ )
    {
        
// write ticker name
        
fputsName() + "," fh );

        
// write date/time information
        
fputsDateTimeToStrdt] ) + ","fh );

        
//write quotations and go to the next line
        
qs StrFormat"%g,%g,%g,%g,%g\n"O], H], L], C], V] );
        
fputsqsfh );

    }
    
// close file handle
    
fclosefh );
}
 
// line required by SCAN option
Buy 0

Now please select Tools->Send to Analysis, select the list of symbols (e.g. Apply To: Filter, pick the watchlist in the Filter dialog), set Range to All Quotations, and press Scan

How to add exploration results to a watchlist

In order to add analysis results to a selected watchlist manually, we can use context menu from the results list:

Add results to watch list

There is, however, a way to automate this process and add the symbols to a watchlist directly from the code. To do so, we need to:
– check if our Filter variable was true at least once in the tested Analysis range
– based on the above condition, use CategoryAddSymbol() function to add tickers to a watchlist.

Additionally, we can erase the watchlist at the beginning of the test if we want to store just the new results.

The code below shows how to implement this procedure in AFL.

listnum 10// we use watchlist 10 for storing results

// erase the watchlist when we process very first symbol
if ( Status"stocknum" ) == )
{
    
// retrieve watchlist members
    
oldlist CategoryGetSymbolscategoryWatchlistlistnum );

    
// iterate through the list and remove tickers
    
for ( 0; ( sym StrExtractoldlist) ) != ""i++ )
    {
        
CategoryRemoveSymbolsymcategoryWatchlistlistnum );
    }
}

// sample exploration code
Filter ROCClose) > AND Volume 1000000;
AddColumnClose"Close" );
AddColumnROCClose), "ROC" );
AddColumnVolume"Volume" );

// check how many times Filter variable was true in the tested range
// if non-zero value detected, add current symbol to a watchlist
if ( LastValueCumFilter AND Status"barinrange" ) ) )  )
    
CategoryAddSymbol""categoryWatchlistlistnum )

Time compression of data retrieved from another symbol

AmiBroker’s Time-Frame functions (http://www.amibroker.com/guide/h_timeframe.html) allow to use multiple intervals within a single formula and combine them together. Another set of functions in AFL (Foreign and SetForeign) allow us to retrieve data of another symbol from the database, so we can implement strategies where rules are based on multiple symbols.

This article shows how to combine these two features together and properly use Time-Frame functions on data retrieved from another symbol. Let us consider an example of a strategy, which works on daily data, but uses an additional filter based on weekly readings of S&P500 index.

The following sequence is required to code such conditions properly:

  1. switch to the other symbol with SetForeign
  2. compress data into higher interval with TimeFrameSet
  3. store the weekly values / conditions in custom variables
  4. with TimeFrameRestore() or RestorePriceArrays() functions restore the original arrays of the tested symbol (in the original time-frame)
  5. use custom variables assigned in step (3) expanded to original time-frame using TimeFrameExpand()

Here is the AFL formula, which implements the above conditions:

// first switch to ^GSPC symbol
SetForeign"^GSPC" );
//
// compress data to weekly interval
TimeFrameSetinWeekly );
//
// assign weekly values to custom variables
indexWeeklyClose Close;
indexWeeklyMA =  MAClose52 );
indexWeeklyFilter Close MAClose52 );
//
// restore original arrays (back to the primary symbol)
// RestorePriceArrays() function is an equivalent
TimeFrameRestore();
//
// align data back to original interval
indexFilterExpanded TimeFrameExpandindexWeeklyFilterinWeekly );
//
// exploration shows the results, note that all weekly values
// need to be expanded if we haven't done it yet
//
Filter 1;
AddColumnClose"Close AAPL" );
AddColumnTimeFrameExpandindexWeeklyCloseinWeekly ), "Weekly close ^GSPC" );
AddColumnTimeFrameExpandindexWeeklyMAinWeekly ), "Weekly MA ^GSPC" );
AddColumnindexFilterExpanded"Weekly index filter")

Let us compare the readings obtained from the code with a sample chart – both ^GSPC raw reading and 52-week MA values match the chart and the condition is properly aligned to the bars starting on 2011-10-28 and extends until new weekly bar is formed.

TimeFrame + Foreign

There is also an alternative method we can use:

  1. retrieve values from ^GSPC using Foreign() function
  2. compress these readings into weekly interval using TimeFrameCompress
  3. perform calculations on weekly compressed array
  4. expand the compressed data back to the original timeframe using timeFrameExpand
indexClose Foreign("^GSPC","C");
indexWeeklyClose2 TimeFrameCompressindexCloseinWeekly );
indexWeeklyMA2 MAindexWeeklyClose252 );
indexWeeklyFilter2 indexWeeklyClose2 indexWeeklyMA2;
//
Filter 1;
AddColumnClose"Close AAPL" );
AddColumnTimeFrameExpandindexWeeklyClose2inWeekly ), "Weekly close ^GSPC" );
AddColumnTimeFrameExpandindexWeeklyMA2inWeekly ), "Weekly MA ^GSPC" );
AddColumnTimeFrameExpandindexWeeklyFilter2inWeekly ), "Weekly index filter")

How to setup automatic periodic scans & explorations

One of the most powerful features of AmiBroker is the ability of screening even hundreds of symbols in real-time and monitor the occurrence of trading signals, chart patterns and other market conditions we are looking for. This can be done in Analysis module with Scan or Exploration features.

The main difference between Scan and Exploration is that Exploration allows to customize the output shown in Analysis window (this is explained in details in the following tutorial chapter: http://www.amibroker.com/guide/h_exploration.html), while Scan performs search for at least one of Buy, Sell, Short, Cover signals and displays predefined set of columns. Both these features allow for continuous screening of the database in real-time conditions.

The following procedure shows how to configure basic scan formula and generate alerts when conditions coded in the formula are met. We assume that AmiBroker is already configured to receive real-time data from one of realtime data vendors – the list of recommended datasources is available here: http://www.amibroker.com/guide/h_quotes.html

We need to do the following:
– open Formula Editor window with Analysis->Formula Editor command from the menu
– in the editor window enter or paste the code below

// example trading signals defined here
Buy CrossMACD(), Signal() );
Sell CrossSignal(), MACD() );
//
// additional part of the formula which generates audio alerts when condition is detected
AlertIFBuy"SOUND C:\\Windows\\Media\\Ding.wav""Audio alert");
AlertIFSell"SOUND C:\\Windows\\Media\\Ding.wav""Audio alert")

After entering the code use Tools->Send to Analysis as shown below:

Send to Analysis

Then in the Analysis window select Apply To: All Symbols, Range: 1 Recent bar, this defines which symbols are included in the screening and what time-range will be shown in the results list.

Range setting

To enable continuous screening, mark Auto-repeat (AR) Scan/Explore option and enter the repeat interval. The interval can be specified in minutes or seconds (for example entering 10s means 10-seconds, while 5m means 5-minutes). The below example uses 15-second repeat interval:

Auto-repeat setting

NOTE: If that is the very first screening after launching the database and it may require filling the historical quotes, then it is also required to mark Wait for Backfill (applies to data sources, which support this feature, see: http://www.amibroker.com/guide/h_rtsource.html for more details).

Now press Scan button to initiate the screening process:

Scan

The results window will show the hits and generated alerts will also be logged in Alert Output window and the scan will be automatically repeated every 15 seconds in search for new signals.

Scan

More information about generating and configuration formula-based alerts is presented in this tutorial: http://www.amibroker.com/guide/h_alerts.html

Debugging techniques – Part 1 – Exploration

From time to time people send us their formulas asking what happens in their own code. Or they do not know why given trade is taken or not. These questions are usually caused by the fact that people lack the insight what is happening inside and what values values their variables hold.

The first general-purpose debugging technique is using Exploration.

You need to add several AddColumn statements and run your code as Exploration, so you can actually see the values of all variables. This will reveal whenever you really have values that you expect and would make it easier for you to understand what is happening inside your code.

In simplest form add this code to your system formula:

Filter 1// show all bars
AddColumnBuy"Buy" )

and it will show you if you are getting expected values in Buy array. You can use the same technique to track the content of any variable. Add as many columns as you want. You would be surprised how much insight into your own code you will get.

You can use Exploration to learn how particular function works, for example, if you don’t understand how ValueWhen works, you can display its results this way:

Filter 1// show all bars
//
MAC10 );
cond CrossC);
bi BarIndex();
//
AddColumnC"Close" );
AddColumnm"Mov Avg" );
AddColumncond"Condition");
AddColumnbi"BarIndex" );
AddColumnValueWhencondbi ), "ValueWhen( cond, BarIndex() )" );
AddColumnValueWhencondClose), "ValueWhen( cond, Close )" )

If you run above code you will clearly see how ValueWhen picks the value when condition is true and “holds” it for all other bars (when condition is false).

Debug using Exploration

Once you get this level of insight into your code you will be better equipped to fix any errors.
Exploration is number one choice in getting detailed view on what is happening inside your code.

For more information about Exploration see http://www.amibroker.com/guide/h_exploration.html

How to detect the study crossover for multiple symbols with use of SCAN

It’s possible to use Automatic Analysis window to search for trendline (or other study) crossovers for multiple symbols at once. It’s necessary to do the following:

1. Draw trendlines on the chart and assidn them a STUDY ID – two letter code that allows to recognise the particular study. To do this, go to study properties (Alt+Enter) after you draw the line (in this example – StudyID = “RE”).

study1.gif

2. Repeat the process for other symbols (remember to draw the trendlines in the same chart pane).

3. Check the CHART ID (in order to call this particular chart pane from the SCAN). To check the ChartID – click on the chart with right mouse button, go to: PARAMETERS -> Axes&Grid (in this example – CHARTID = 1023).

study2.gif

4. Now we can write the formula:
– Analysis -> Formula Editor
– enter:

Buy = Cross( Close, Study(“RE”, 1023) );

(note that we use the same StudyID and ChartID in the formula)
– Tools -> Send to analysis.
– Apply To: All Symbols, All Quotations
– press SCAN

How to export quotations from AmiBroker to CSV file ?

The easiest way to export quotes to CSV file is to use the below formula from Automatic Analysis window:
(Analysis -> Automatic Analysis)
(more…)