January 25, 2016
How to read highest high value of future bars
Built in HHV and LLV functions allow to read highest high or lowest low of n-past bars. If we want to refer to future values, there is an easy way to do it using simple Ref function and just shift HHV or LLV reading from N-bars ahead. A ready to use function showing such approach is presented below:
// function definitions
function futureHHV( array, periods )
{
return Ref( HHV( array, periods ), periods );
}
function futureLLV( array, periods )
{
return Ref( LLV( array, periods ), periods );
}
// sample use
Plot( Close, "Close", colorDefault, styleBar );
Plot( HHV( H, 20 ), "HHV", colorGreen, styleDashed );
Plot( futureHHV( H, 20 ), "Future HHV", colorGreen, styleThick );
Plot( LLV( L, 20 ), "LLV", colorRed, styleDashed );
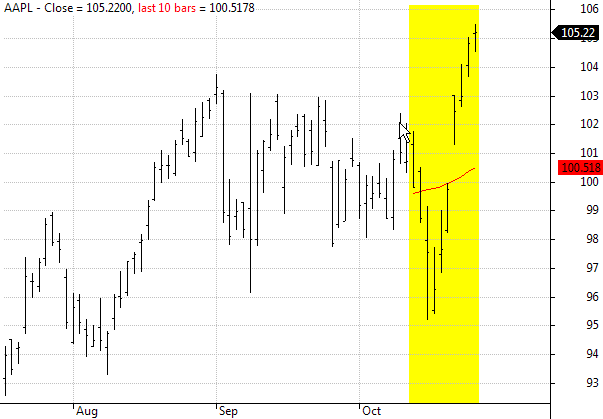
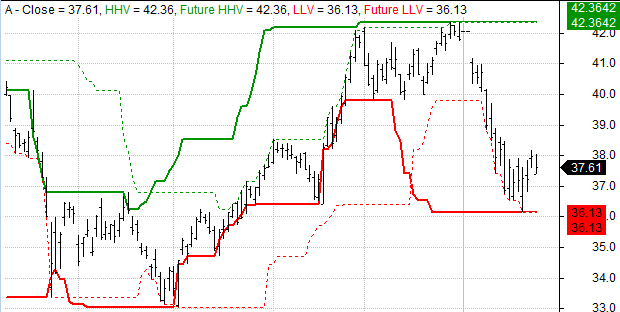
Plot( futureLLV( L, 20 ), "Future LLV", colorRed, styleThick )And here is the chart produced by the formula above:
 Filed by Tomasz Janeczko at 7:25 am under Indicators
Comments Off on How to read highest high value of future bars