amibroker

HomeKnowledge Base

Using per-symbol parameter values in charts

Parameter values in AmiBroker are stored separately for each ChartID. A ChartID is a number that uniquely identifies chart. This makes it possible that parameters having same name can hold different values when they are used in different charts (different ChartIDs). This also allows to share parameters if two panes use same ChartID. (A detailed explanation can be found here: http://www.amibroker.com/kb/2014/10/06/relationship-between-chart-panes/ )

For this reason, if we want to have separate chart parameters for each symbol, we need to set up separate chart for every symbol. To do so, follow these steps:

  1. create several new chart windows using File->New->Blank Chart (or choosing New Blank Chart from the menu under + button in MDI tabs area)
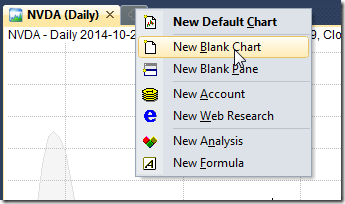
    New Blank Chart

  2. drag Price( all in one) formula or any other indicators onto each of the newly opened windows
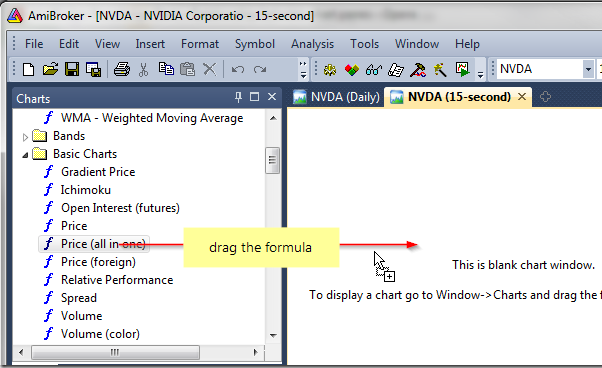
    Drag-drop chart

  3. select different active symbol for every chart
  4. define parameters individually and save the whole layout in the Layouts window

As a result – we have a setup of several chart windows, where we can quickly access given symbol showing chart with its separately stored parameters.
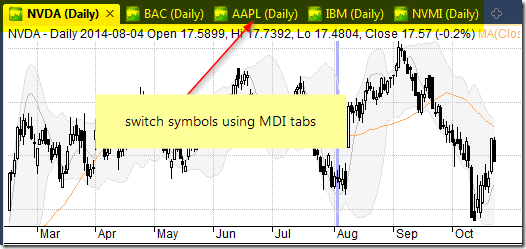
MDI Charts

There is also a way to handle the chart parameter values directly from the AFL formula, which would detect the active symbol and set the parameter values accordingly. Here is an example of such implementation using switch statement:
http://www.amibroker.com/guide/keyword/switch.html

To display this chart, open the Formula Editor, enter the following code and then press Apply Indicator button.

// detect the active symbol and store in n variable
Name();

// set parameter values based on the symbol name
switch ( )
{
// values for MSFT symbol
case "MSFT":
    
MA1periods 10;
    
MA2periods 21;
    break;

// values for IBM and NVDA
case "IBM":
case 
"NVDA":
    
MA1periods 30;
    
MA2periods 40;
    break;

// values for other tickers
default:
    
MA1periods 50;
    
MA2periods 100;
    break;
}

PlotClose"C"colorDefaultstyleBar );

PlotMACloseMA1periods ) , "MA(" MA1Periods ")" colorRed );
PlotMACloseMA2periods ) , "MA(" MA2Periods ")"colorBlue )

This way we can handle all individual parameter values within a single chart pane.

How to create toolbar button for custom interval

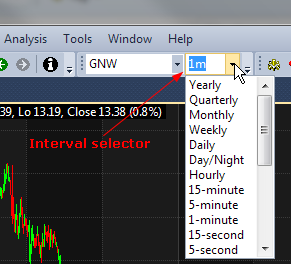
IMPORTANT NOTE: Before you add toolbar buttons for dozens of intervals please note that any interval can be picked from Interval Selector combo-box. If given interval is not present, you can just type it: 7m means 7-minute, 3h means 3-hour, 2D is 2-day), as shown below:

Custom time intervals

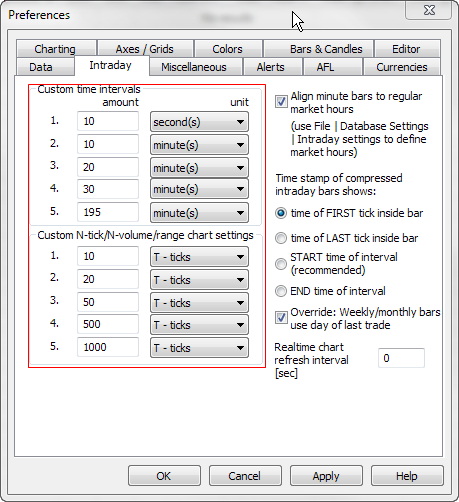
In order to add custom time-interval buttons onto the toolbar we first need to define our custom intervals in Tools->Preferences->Intraday:

Custom time intervals

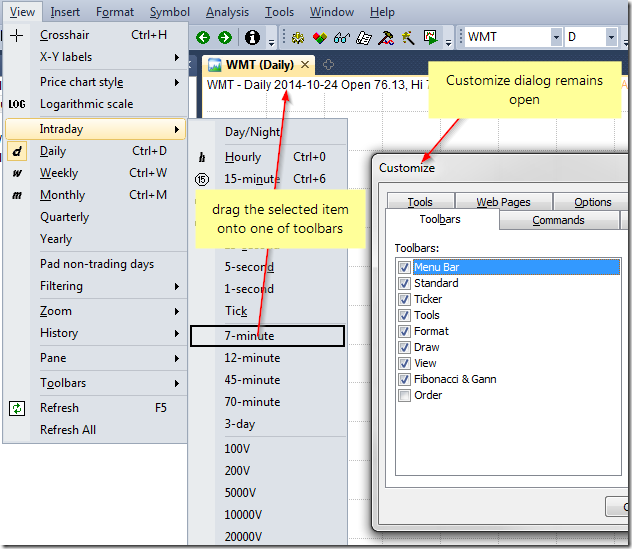
Now, in order to customize the toolbar go to Tools-> Customize menu. That switches AmiBroker into special customization mode.

Now, while keeping the customize dialog open, we can just go to View->Intraday menu and pick the items we need, then start dragging it with the mouse cursor to the toolbar of our choice.

Custom time intervals

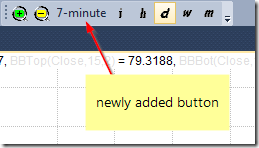
If we keep holding down CTRL key while dragging the items, a copy will be created on the toolbar, so the items will not be removed from the original menu.

Custom time intervals

It is also possible to replace the default text-description with a button image. This is further explained in the manual:
http://www.amibroker.com/guide/h_customizeui.html

How to backup AmiBroker configuration

By default AmiBroker stores all its files and databases inside AmiBroker installation folder. Standard AmiBroker installation path is:
C:\Program Files\AmiBroker (32-bit program installed on 32-bit Windows or 64-bit program installed on 64-bit Windows)
or
C:\Program Files (x86)\AmiBroker (32-bit program installed in 64-bit Windows)

The best way to secure our setup is to make a copy of the entire AmiBroker folder with all its subfolders. No special tools are required for this operation – the entire directory can be copied into new location using Windows Explorer.

That allows to quickly restore the entire working setup if anything goes wrong just by copying the whole contents of AmiBroker folder back.

We need to remember that if we store our databases in locations outside AmiBroker folder, then we would need to backup the database folders as well. The same applies when we use custom location for Formula tree root path defined in Tools->Preferences->AFL. If the formulas are stored outside AmiBroker folder, then they would need to be copied as well.

For the purpose of handing individual elements of the configuration – the list of AmiBroker important files is available in the manual:
http://www.amibroker.com/guide/x_files.html

In particular, in order to backup / restore layouts we need to copy the entire Formulas folder, broker.newcharts file and the layout files you have in the other machine. This is because layouts refer to certain charts recognized by their chart ID number. So – all elements have to be present:
.awl files (holding layouts calling certain charts recognized by their ID)
broker.newcharts file which contains list of charts (their IDs) and their corresponding formula files
– contents of Formulas folder – to have formula referenced by certain charts

It is also good idea to have a backup of your entire disk. Such disk-imaging programs allow to restore entire computer setup in a matter of minutes without need to re-install Windows and all the programs. Two popular disk imaging programs are: Macrium Reflect or Acronis True Image and they allow backups to be done even while you are working.

For advanced users:

Certain settings and customizations of user interface are stored in the system registry. AmiBroker uses keys under:

HKEY_CURRENT_USER\Software\TJP\Broker\

Using Regedit tool allows to backup and restore registry keys too. To export AmiBroker registry key follow these steps:

  1. Click Start, type regedit.exe in the search box, and then press Enter
  2. Find HKEY_CURRENT_USER\Software\TJP\Broker\
  3. Right-click on the selected key and choose EXPORT from the context menu and save the file.

The following Microsoft KB article explains the procedure:
http://support2.microsoft.com/kb/322756

How to correct forward looking timestamps

Some platforms, like Tradestation, use “future looking” timestamps in their data so for example 5 minute bar covering market activity from 9:30:00 till 9:34:59 is stamped with 9:35:00 (future time – see Tradestation manual explaining their timestamps) so their data have a kind of future offset.

AmiBroker, on the other hand, uses and expects natural timestamping, in which data from 9:30 are marked with 9:30 timestamp, so data from 9:30:00 until 9.34:59 belong to 9:30 5-minute bar.

If you want to use future-timestamped data in AmiBroker you need to remove the offset.

To do so, you need to shift the timestamps back by the amount equal to the base data interval during import process. In case of 5-minute bars, you need to shift data by -5 minutes.

To shift the data during import you can use $TIMESHIFT command of ASCII importer, see http://www.amibroker.com/guide/d_ascii.html

$TIMESHIFT offset_in_hours

the offset_in_hours parameter defines the time in hours that should be added to imported timestamps. You can use negative and fractional values too. Each minute is 1/60 of hour so shifting back by 1-minute would be -0.01666667.

If you are using ASCII Importer Wizard, and want to import 5-minute data with future looking timestamps, you can simply type the following in the “Additional commands” box of ASCII Importer Wizard.

$TIMESHIFT -0.08333333333333

-0.08333333 is a result of dividing 5 by 60 (number of minutes in an hour)

Please find out what time-stamping method is used by your data provider because it is important to know that to get your higher-interval charts right.

How to exclude top ranked symbol(s) in rotational backtest

Rotational trading is based on scoring and ranking of multiple symbols based on user-defined criteria. For each symbol a user-definable “score” is assigned on bar by bar basis. Then, each bar, symbols are sorted according to that score and N top ranked symbols are bought, while existing positions that don’t appear in top N rank are closed.

Sometimes however, we may want to exclude the highest ranking symbol (or a couple of them) from trading. The code below shows how to do that using custom backtester.

ExcludeTopN 1// how many top positions to exclude
SetCustomBacktestProc("");

if ( 
Status"action" ) == actionPortfolio )
{
    
bo GetBacktesterObject();
    
bo.PreProcess();

    for ( 
bar 0bar BarCountbar++ )
    {
        
Cnt 0;
        for ( 
sig bo.GetFirstSignalbar ); sigsig bo.GetNextSignalbar ) )
        {
            if ( 
Cnt ExcludeTopN )
                
sig.Price = -1// exclude

            
Cnt++;
        }

        
bo.ProcessTradeSignalsbar );
    }

    
bo.PostProcess();
}

EnableRotationalTradingTrue );

SetOption"MaxOpenPositions");
SetOption"WorstRankHeld"10 );
SetPositionSize20spsPercentOfEquity );
PositionScore RSI14 )

The code is pretty straightforward mid-level custom backtest loop but it uses one trick – setting signal price to -1 tells AmiBroker to exclude given signal from further processing. Note also that signals retrieved by GetFirstSignal / GetNextSignal are already sorted, so the highest ranked signal appears first in the list.

How to force Line chart style for specific symbols (like mutual funds)

There is an easy way to avoid switching the price chart style back and forth if we want e.g. to display a candlestick chart for our stock symbols, but a line chart for just a subset of tickers in our database (e.g. mutual funds).

To achieve that – we need to set Continuous Quotations option to No in Symbol->Information window for the symbols that have only one price fixing per day (only close price available).

Continuous Quotations

Then – if we choose View->Price Chart Style to Auto – the chart will automatically use Line style for all symbols that have Continuous quotations option set to No. Other symbols will still use Candlesticks chart style.

Automatic style

How to export chart image to a file

Charts can be exported as GIF or PNG files either manually or programmatically.

To export chart image manually, simply use Edit->Image->Export to file menu. Instead of exporting you can also copy the image to Windows clipboard (Edit->Image->Copy As Bitmap – this will copy bitmap image or Edit->Image->Copy As Metafile – this will copy vector/scalable graphic).

In order to export image in programmatic manner (from external program), you can use OLE automation interface described here http://www.amibroker.com/guide/objects.html

Below is a sample JScript code that shows how to use OLE interface from the script:

AB = new ActiveXObject("Broker.Application");
AW AB.ActiveWindow;
AW.ExportImage"C:\\example.gif"640480 ); // 640, 480 are pixel dimension

The code is intended to be used from the outside of AmiBroker.

To use above code follow these steps:

  1. Open Notepad
  2. Copy-paste above the code
  3. Save the file with .JS extension (which means that system will treat this as JScript code)
  4. Make sure that AmiBroker is running with desired chart as active one
  5. Double click on .JS file to execute the JScript code

After doing so, resulting example.gif image file can be found on C: drive.

OLE automation can also be used from any other COM/OLE-aware programs/languages.

Time compression of data retrieved from another symbol

AmiBroker’s Time-Frame functions (http://www.amibroker.com/guide/h_timeframe.html) allow to use multiple intervals within a single formula and combine them together. Another set of functions in AFL (Foreign and SetForeign) allow us to retrieve data of another symbol from the database, so we can implement strategies where rules are based on multiple symbols.

This article shows how to combine these two features together and properly use Time-Frame functions on data retrieved from another symbol. Let us consider an example of a strategy, which works on daily data, but uses an additional filter based on weekly readings of S&P500 index.

The following sequence is required to code such conditions properly:

  1. switch to the other symbol with SetForeign
  2. compress data into higher interval with TimeFrameSet
  3. store the weekly values / conditions in custom variables
  4. with TimeFrameRestore() or RestorePriceArrays() functions restore the original arrays of the tested symbol (in the original time-frame)
  5. use custom variables assigned in step (3) expanded to original time-frame using TimeFrameExpand()

Here is the AFL formula, which implements the above conditions:

// first switch to ^GSPC symbol
SetForeign"^GSPC" );
//
// compress data to weekly interval
TimeFrameSetinWeekly );
//
// assign weekly values to custom variables
indexWeeklyClose Close;
indexWeeklyMA =  MAClose52 );
indexWeeklyFilter Close MAClose52 );
//
// restore original arrays (back to the primary symbol)
// RestorePriceArrays() function is an equivalent
TimeFrameRestore();
//
// align data back to original interval
indexFilterExpanded TimeFrameExpandindexWeeklyFilterinWeekly );
//
// exploration shows the results, note that all weekly values
// need to be expanded if we haven't done it yet
//
Filter 1;
AddColumnClose"Close AAPL" );
AddColumnTimeFrameExpandindexWeeklyCloseinWeekly ), "Weekly close ^GSPC" );
AddColumnTimeFrameExpandindexWeeklyMAinWeekly ), "Weekly MA ^GSPC" );
AddColumnindexFilterExpanded"Weekly index filter")

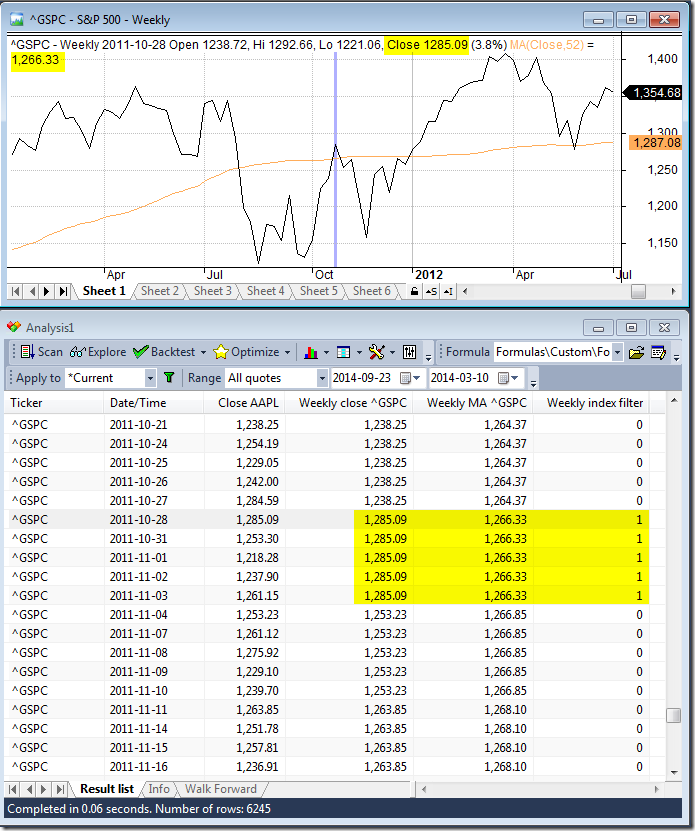
Let us compare the readings obtained from the code with a sample chart – both ^GSPC raw reading and 52-week MA values match the chart and the condition is properly aligned to the bars starting on 2011-10-28 and extends until new weekly bar is formed.

TimeFrame + Foreign

There is also an alternative method we can use:

  1. retrieve values from ^GSPC using Foreign() function
  2. compress these readings into weekly interval using TimeFrameCompress
  3. perform calculations on weekly compressed array
  4. expand the compressed data back to the original timeframe using timeFrameExpand
indexClose Foreign("^GSPC","C");
indexWeeklyClose2 TimeFrameCompressindexCloseinWeekly );
indexWeeklyMA2 MAindexWeeklyClose252 );
indexWeeklyFilter2 indexWeeklyClose2 indexWeeklyMA2;
//
Filter 1;
AddColumnClose"Close AAPL" );
AddColumnTimeFrameExpandindexWeeklyClose2inWeekly ), "Weekly close ^GSPC" );
AddColumnTimeFrameExpandindexWeeklyMA2inWeekly ), "Weekly MA ^GSPC" );
AddColumnTimeFrameExpandindexWeeklyFilter2inWeekly ), "Weekly index filter")

How to customize list-view columns

A list-view is a view that displays a list of scrollable items in a table-like format. List-views are used in Real-Time quote window, Analysis window, Symbol list, etc. The columns in any list-view in AmiBroker can be customized in various ways to better match our needs and display the required statistics and readings the way we find it most useful. For the sake of example let us consider Analysis window result list.

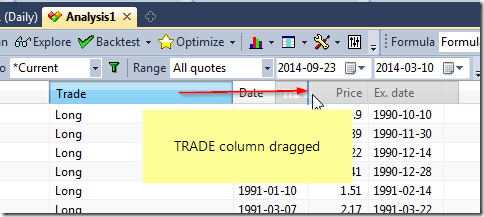
Many of the customization actions can be performed directly on the column headers. It is possible to re-order the columns by dragging them with mouse cursor:

Column drag

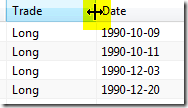
and their width can be re-sized by dragging the divider lines between columns (double-clicking on that area will auto-resize the columns to match their contents).

Column resize

Hint: You can auto-resize all columns to their content at once by holding down Ctrl key and pressing + (plus sign) key on the numeric keypad.

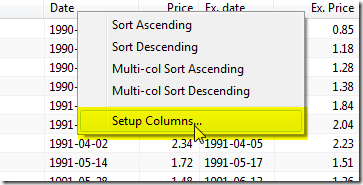
For more operations it is possible to use Setup Columns… menu available from the context menu, which displays after right-clicking on the headers.

Column resize

Setup Columns dialog allows to re-order, hide/show selected columns.

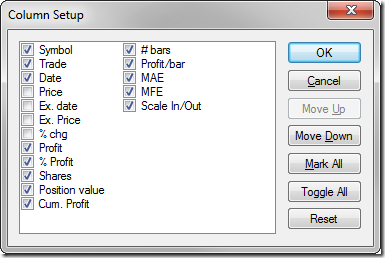
Column setup

To hide a column uncheck the box, to show it back again, check the box. To re-arrange columns, select a column and click Move Up/Move Down buttons.

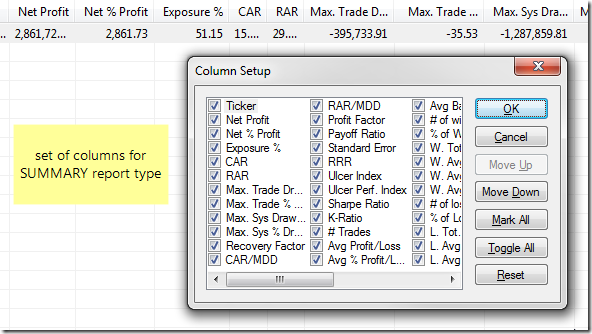
It is important to remember that the set of columns will depend on the last run mode, so it will be different for Scan, for the Backtest Trade List, for Summary type of report or Optimization.

Column setup 2

Further customization options are available programmatically. Custom Backtest interface allows to add your own metrics to the backtest report (more info: http://www.amibroker.com/guide/a_custommetrics.html)

We can also define in our code where those additional columns are positioned in the report (this includes both custom metrics added to the report or optimized parameter values in the Optimization). By default they would be listed at the very end, but SetOption() function allows to set different position, for example:

SetOption("ExtraColumnsLocation")

Using price levels with ApplyStop function

ApplyStop function by default requires us to provide stop amount (expressed in either dollar or percentage distance from entry price). Therefore, if we want to place stop at certain price level, then we need to calculate the corresponding stop amount in our code.

This example shows how to place stops at previous bar Low (for long trades) and previous bar High (for short trades).

Stop amount parameter is simply the distance between entry price and desired trigger price (exit point). For long trade it is entry price minus stop level, while for short trade it is trigger (exit) price minus entry price. Additionally we may check if calculated distance is at least 1-tick large. We can distinguish between long and short entry by checking if one of entry signals is present (if a Buy signal is active then it is long entry, otherwise short). We only need to take care about the fact that if we are using trade delays we need to get delayed Buy signal as shown in the code below:

TradeDelay 1// set it to 0 for no delays

SetTradeDelaysTradeDelayTradeDelayTradeDelayTradeDelay );
TickSize 0.01;

// sample entry rules
Buy CrossMACD(), Signal() );
Short CrossSignal(), MACD() );
Sell Cover 0// no other exit conditions, just stops

BuyPrice SellPrice ShortPrice CoverPrice Close;

// define stop level
stopLevelLong RefL, -); // use previous bar low
stopLevelShort RefH, -); // use previous bar high

// calculate stop amount
stopAmountLong BuyPrice stopLevelLong;
stopAmountShort stopLevelShort ShortPrice;

// make sure stop-amount is at least one tick
stopAmountLong MaxTickSizeBuyPrice stopLevelLong );
stopAmountShort MaxTickSizestopLevelShort ShortPrice );

// assign stop amount conditionally by checking if there is a Buy signal on given bar
IsLong RefBuy, -TradeDelay );
stopAmount IIfIsLongstopAmountLongstopAmountShort );
ApplyStopstopTypeLossstopModePointstopAmountTrue )
Next Page »