amibroker

HomeKnowledge Base

Using multiple watchlists as a filter in the Analysis

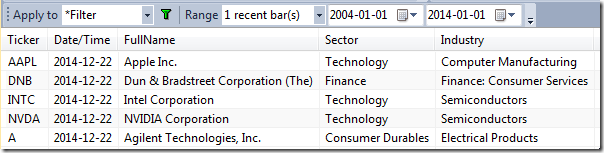
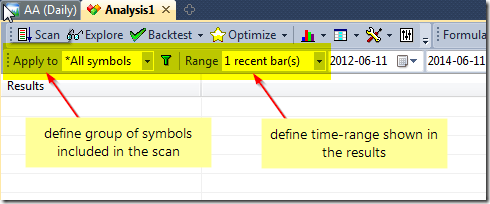
The Filter window in the Analysis screen allows us to define a filter for symbols according to category assignments, for example watchlist members (or a result of mutliple criteria search).

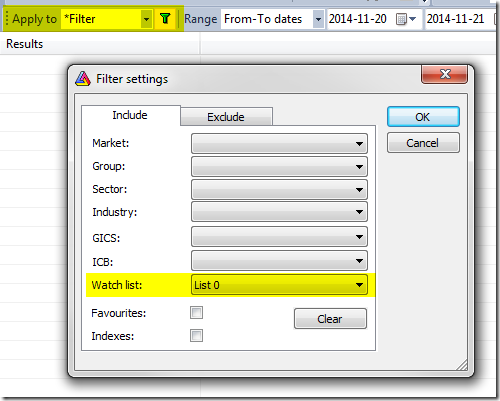
The filter allows us to select one watch list for “inclusion” and one for “exclusion”. To include members of more than one watchlist, we can not simply pick them both in the Filter window – we need to combine these symbols together in another dedicated watchlist storing symbols from both lists.

Let us say we want to run a test on members of List 1 and List 2. To combine these watchlists together we need to follow the instructions below.

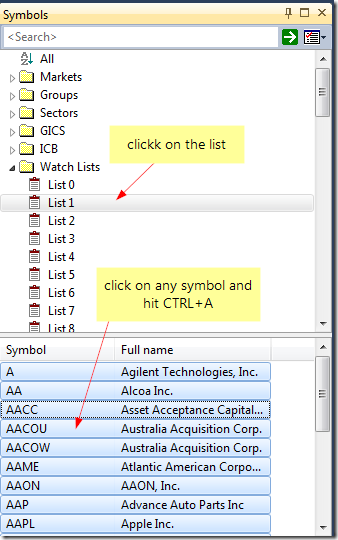
  1. Click on List 1, then in the bottom part of the Symbols window mark all tickers. A multiple selection is done by clicking on first and last item in the list while holding down the Shift key. We may also select all symbols by clicking on any symbol and pressing Ctrl+A key.

    Select symbols from watch list

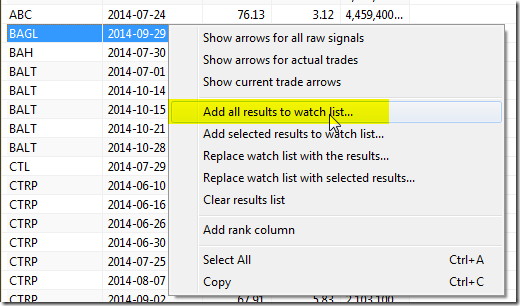
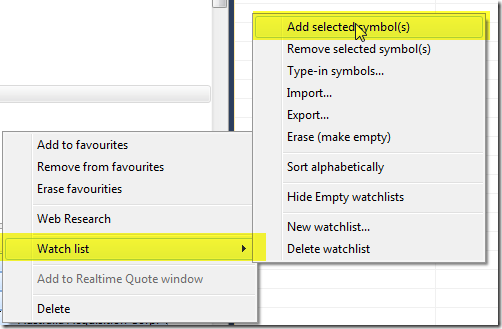
  2. Now click on the selection with right mouse button and choose Watch list->Add selected symbol(s)

    Add symbols to watch list

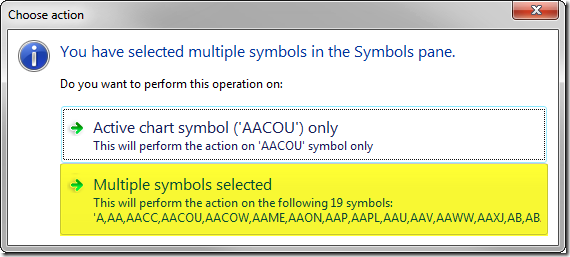
  3. Pick an empty watchlist that we will use to combine our tickers (e.g. List 5 ) and confirm to add multiple symbols:

    Confirm adding multiple symbols

  4. Repeat the above steps 1-3 with List 2 members
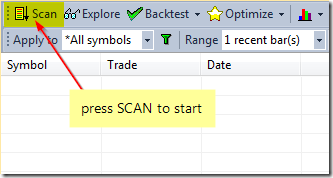
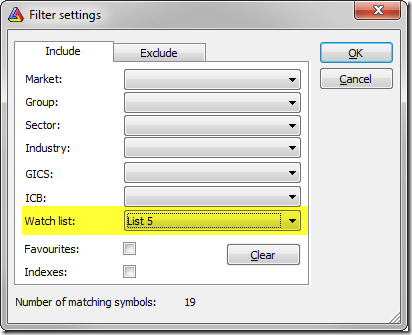
  5. Now we can pick List 5 in the Filter window and run the test on all the tickers

    Create new watch list

An alternative solution to this is to filter out unwanted symbols in the code. In this case AmiBroker would need to run analysis for all tickers (so Apply to would need to be set to All symbols) and apply filtering while executing your formula. To do so you may use code like this for backtesting (filtering Buy signals):

Buy /* your regular trading rules here */;

watchlistCheck InWatchList) OR InWatchList);
Buy watchlistCheck  AND Buy// combine watch list filter with your rule

or code like this in exploration (adding extra condition to Filter variable):

Filter /* your regular exploration filter here */;
watchlistCheck InWatchList) OR InWatchList);
Filter watchlistCheck AND Filter// combine watch list filter with your rule

Please keep in mind that filtering in the code is significantly slower. Using this method AmiBroker needs to read the data for all tickers, prepare arrays, then evaluate the formula and verify the condition – so using Filter window and the first approach will be faster, as the filtering is done before the formula execution, saving lots of time required for data retrieval and AFL execution.

Text output in Explorations

Explorations allow to display not only numerical data but also text, there are however certain restrictions what can and can’t be displayed in the exploration result list as a text.

AddTextColumn() function allows to display strings, so we can use it for displaying e.g. full name of the symbol or category assignment information:

Filter 1;
AddTextColumnFullName(), "FullName");
AddTextColumnSectorID(1), "Sector");
AddTextColumnIndustryID(1), "Industry");
AddColumnClose"Close")

Exploration Text output

It is worthwhile to note that these strings displayed above do not vary across historical bars. That is important, because there is no such structure in AFL as an ‘array of strings’, therefore an attempt to generate a text, which varies on each bar will not work. Instead a string representing selected array value (or last value) will be displayed.

Let us check such a formula to illustrate the above statement:

condition Close Open;

Filter 1;
AddColumnOpen"Open" );
AddColumnClose"Close" );
AddColumncondition"Condition"1.0);

// WriteIf returns a SINGLE STRING representing condition at last bar of selected range
text WriteIfcondition"Close above Open""Close below Open" );
// the text variable represents value AT THE LAST BAR of selected range
AddTextColumntext"text" )

If we look at the output over more than one bar, then we can see that the condition from the last bar determines the text output in the column:

Exploration Text output

Therefore, such approach as above can only be used in situations where we run the exploration applied e.g. to 1-Recent bar, because it’s the last bar from the range which determines the text displayed in the column in such situation.

If you want to display the value for other bars than last bar of selected range, you need an extra column, like this:

condition Close Open;

Filter 1;
AddColumnOpen"Open" );
AddColumnClose"Close" );
AddColumncondition"Condition"1.0);

// WriteIf returns a SINGLE STRING representing condition at last bar of selected range
text WriteIfcondition"Close above Open""Close below Open" );
AddTextColumntext"Last bar text" ); 

// Note that we are now using Ref() function to reference previous bar data
text2 WriteIfRefcondition, -), "Close above Open""Close below Open" );
AddTextColumntext2"Previous bar text" )

You can use functions like Ref() or ValueWhen() to refer to other bar’s data, or you can use array subscript operator like this condition[ 1 ] to get value of condition at bar with index 1.

There is an alternative method to display values that change on bar by bar basis as letters though. Instead of displaying full string we can display single characters in a column using formatChar parameter, as shown in the code below:

Version5.90 ); // only works for version 5.90 and above
Buy CrossMACD(), Signal() );
Sell CrossSignal(), MACD() );

Filter Buy OR Sell;
AddColumnIIfBuy'B''S' ), "Signal"formatChar )

Exploration Text output

Note: If you are using version older than 5.90, you need to use Asc function instead of single-character literals, as shown below:

Buy Cross(MACD(),Signal());
Sell Cross(Signal(),MACD());

Filter Buy OR Sell;
AddColumnIIfBuyAsc("B"), Asc("S")), "Signal"formatChar )

More information about explorations can be found in the manual:
http://www.amibroker.com/guide/h_exploration.html

How to display correlation between symbols

For the purpose of calculating the correlation between two data-arrays, there is a Correlation() function in AFL which can be used.

In order to display a correlation chart, please select Analysis–>Formula Editor menu and enter the following code:

SetChartOptions0chartShowArrows|chartShowDates);
Ticker ParamStr"Symbol"Name() );
range Param"Periods"25225001);

corr CorrelationCloseForeignTicker"C"), range );
Plotcorr"Correlation " Name() + "/" ticker,
      
ParamColor"Color"colorRed ), ParamStyle"Style"styleLine ) );

// check if different symbols are used
if( ticker == Name() )
    
Title "Please select different symbol from Parameter dialog"

Now select Tools->Apply Indicator. Initially the code will pick the selected symbol’s Close prices for both arrays, so we either need to change the selected ticker in the chart or the second symbol, which can be defined in Parameters dialog.

We can also use Exploration feature to display a correlation matrix e.g. for the watchlist members. The below example shows the process for Watchlist 0 members.

The formula to display correlation table looks as follows:
// read the list of symbols from Watchlist 0
symlist CategoryGetSymbolscategoryWatchlist);

// display only last bar from the Analysis range
Filter Status"lastbarinrange" );

// iterate through symbols
for ( 0; ( sym StrExtractsymlist) ) != ""i++ )
{
    
// calculate correlation over 252 bars
    
Corr CorrelationCForeignsym"C" ), 252 );

    
// set color dynamically based on correlation values
    // and display the output in exploration column
    
Clr 32 SelectedValueCorr ) * 32;
    
AddColumnCorrsym1.2,
               
ColorHSB128 Clr255255 ),
               
ColorHSBClr255255 ) );
}

SetSortColumns)

To use the formula we need to do the following:

  1. assign some symbols to watchlist 0
  2. select Analysis->Formula Editor menu
  3. in the AFL Editor enter the code listed above
  4. select Tools->Send to Analysis menu
  5. in the Analysis window, select Apply to: Filter (in Include tab hit Clear and pick watchlist 0)

    Filter dialog

  6. select Range: 1 Recent bar (in case of longer range, last bar of the range will be used for output)
  7. press Explore button

Here is a sample output table:

Correlation Matrix

Be careful and try not to put 10000 items in the watch list because it would need to create a table with 10K columns. Windows has some limits on pixel width of the list view and it would truncate display when the display width (scrollable area inside list) exceeds 32767 pixels. That makes it practical only to display matrices of not more than about 1000-2000 columns.

How to add exploration results to a watchlist

In order to add analysis results to a selected watchlist manually, we can use context menu from the results list:

Add results to watch list

There is, however, a way to automate this process and add the symbols to a watchlist directly from the code. To do so, we need to:
– check if our Filter variable was true at least once in the tested Analysis range
– based on the above condition, use CategoryAddSymbol() function to add tickers to a watchlist.

Additionally, we can erase the watchlist at the beginning of the test if we want to store just the new results.

The code below shows how to implement this procedure in AFL.

listnum 10// we use watchlist 10 for storing results

// erase the watchlist when we process very first symbol
if ( Status"stocknum" ) == )
{
    
// retrieve watchlist members
    
oldlist CategoryGetSymbolscategoryWatchlistlistnum );

    
// iterate through the list and remove tickers
    
for ( 0; ( sym StrExtractoldlist) ) != ""i++ )
    {
        
CategoryRemoveSymbolsymcategoryWatchlistlistnum );
    }
}

// sample exploration code
Filter ROCClose) > AND Volume 1000000;
AddColumnClose"Close" );
AddColumnROCClose), "ROC" );
AddColumnVolume"Volume" );

// check how many times Filter variable was true in the tested range
// if non-zero value detected, add current symbol to a watchlist
if ( LastValueCumFilter AND Status"barinrange" ) ) )  )
    
CategoryAddSymbol""categoryWatchlistlistnum )

How to setup automatic periodic scans & explorations

One of the most powerful features of AmiBroker is the ability of screening even hundreds of symbols in real-time and monitor the occurrence of trading signals, chart patterns and other market conditions we are looking for. This can be done in Analysis module with Scan or Exploration features.

The main difference between Scan and Exploration is that Exploration allows to customize the output shown in Analysis window (this is explained in details in the following tutorial chapter: http://www.amibroker.com/guide/h_exploration.html), while Scan performs search for at least one of Buy, Sell, Short, Cover signals and displays predefined set of columns. Both these features allow for continuous screening of the database in real-time conditions.

The following procedure shows how to configure basic scan formula and generate alerts when conditions coded in the formula are met. We assume that AmiBroker is already configured to receive real-time data from one of realtime data vendors – the list of recommended datasources is available here: http://www.amibroker.com/guide/h_quotes.html

We need to do the following:
– open Formula Editor window with Analysis->Formula Editor command from the menu
– in the editor window enter or paste the code below

// example trading signals defined here
Buy CrossMACD(), Signal() );
Sell CrossSignal(), MACD() );
//
// additional part of the formula which generates audio alerts when condition is detected
AlertIFBuy"SOUND C:\\Windows\\Media\\Ding.wav""Audio alert");
AlertIFSell"SOUND C:\\Windows\\Media\\Ding.wav""Audio alert")

After entering the code use Tools->Send to Analysis as shown below:

Send to Analysis

Then in the Analysis window select Apply To: All Symbols, Range: 1 Recent bar, this defines which symbols are included in the screening and what time-range will be shown in the results list.

Range setting

To enable continuous screening, mark Auto-repeat (AR) Scan/Explore option and enter the repeat interval. The interval can be specified in minutes or seconds (for example entering 10s means 10-seconds, while 5m means 5-minutes). The below example uses 15-second repeat interval:

Auto-repeat setting

NOTE: If that is the very first screening after launching the database and it may require filling the historical quotes, then it is also required to mark Wait for Backfill (applies to data sources, which support this feature, see: http://www.amibroker.com/guide/h_rtsource.html for more details).

Now press Scan button to initiate the screening process:

Scan

The results window will show the hits and generated alerts will also be logged in Alert Output window and the scan will be automatically repeated every 15 seconds in search for new signals.

Scan

More information about generating and configuration formula-based alerts is presented in this tutorial: http://www.amibroker.com/guide/h_alerts.html

How to detect the study crossover for multiple symbols with use of SCAN

It’s possible to use Automatic Analysis window to search for trendline (or other study) crossovers for multiple symbols at once. It’s necessary to do the following:

1. Draw trendlines on the chart and assidn them a STUDY ID – two letter code that allows to recognise the particular study. To do this, go to study properties (Alt+Enter) after you draw the line (in this example – StudyID = “RE”).

study1.gif

2. Repeat the process for other symbols (remember to draw the trendlines in the same chart pane).

3. Check the CHART ID (in order to call this particular chart pane from the SCAN). To check the ChartID – click on the chart with right mouse button, go to: PARAMETERS -> Axes&Grid (in this example – CHARTID = 1023).

study2.gif

4. Now we can write the formula:
– Analysis -> Formula Editor
– enter:

Buy = Cross( Close, Study(“RE”, 1023) );

(note that we use the same StudyID and ChartID in the formula)
– Tools -> Send to analysis.
– Apply To: All Symbols, All Quotations
– press SCAN