amibroker

HomeKnowledge Base

How to show price ratio between two symbols

Charting ratios between the prices of two symbols can easily be done with AmiBroker. For this purpose we can use Spread built-in formula available in Charts window:

Inserting Spread formula

Then select the style as Ratio:

Parameter window

The primary symbol (Symbol1) is the one selected in the chart window, the other symbol (Symbol2) is defined in the Parameters window, as presented in the above screenshot.

It is also possible to create such ratio chart programmatically in AFL using the following code:

ratio Foreign("Symbol1""C") / Foreign("Symbol2""C");
Plotratio"ratio"colorRed )

Symbol1 and symbol2 names in the above code need to be replaced with the actual symbol names from our database we want to use.

How to read highest high value of future bars

Built in HHV and LLV functions allow to read highest high or lowest low of n-past bars. If we want to refer to future values, there is an easy way to do it using simple Ref function and just shift HHV or LLV reading from N-bars ahead. A ready to use function showing such approach is presented below:

// function definitions
function futureHHV( array, periods )
{
   return 
RefHHV( array, periods ), periods );
}
function 
futureLLV( array, periods )
{
   return 
RefLLV( array, periods ), periods );
}

// sample use
PlotClose"Close"colorDefaultstyleBar );
PlotHHVH20 ), "HHV"colorGreenstyleDashed );
PlotfutureHHVH20 ), "Future HHV"colorGreenstyleThick );
PlotLLVL20 ), "LLV"colorRedstyleDashed );
PlotfutureLLVL20 ), "Future LLV"colorRedstyleThick )

And here is the chart produced by the formula above:

Future HHV

How to fill background between hand-drawn trend lines

Among built-in drawing tools, the Triangle, Rectangle and Ellipse allow to fill the background with custom color. However, if we wanted to fill the space between manually drawn trend lines, then we could use AFL formula with Study function that allows to detect the position of the line. Then – knowing the arrays of top and bottom lines we could fill the area between with a cloud plot.

A sample formula, which shows such implementation is presented below. The code fills the space between L1 and L2 trendlines (red color) and between upper and lower bands of the regression channel (RU and RL study id’s respectively).

// regular price plot
PlotClose"Close"colorDefaultstyleBar );

// custom function definition
function FillSpaceID1ID2color )
{
   
// get current chart ID
   
chartID GetChartID();

   
// read the positions of the lines
   
l1 Study(ID1chartID );
   
l2 Study(ID2chartID );

   
// draw cloud chart
   
PlotOHLCl1l1l2l2""ColorBlend(colorGetChartBkColor() ), styleCloud|styleNoRescale|styleNoLabelNullNull0, -);
}

// call function and refer to the assigned study ID's
FillSpace"L1","L2"colorRed );
FillSpace"RU","RL"colorBlue )

The chart produced by the formula looks as follows:

Chart with background fill

We need to remember that each line needs to have unique Study ID assigned in the Properties window.

Properties window

In case of regression channel the ID’s of the upper and lower lines are defined in Regression Channel tab:

Properties window

If we wanted to handle more lines, then it may be more practical to process the list of study ID’s defined in a custom string instead of individual function calls.

// regular price plot
PlotClose"Close"colorDefaultstyleBar );

// custom function definition
function FillSpaceID1ID2color )
{
   
// get current chart ID
   
chartID GetChartID();

   
// read the positions of the lines
   
l1 Study(ID1chartID );
   
l2 Study(ID2chartID );

   
// draw cloud chart
   
PlotOHLCl1l1l2l2""ColorBlend(colorGetChartBkColor() ), styleCloud|styleNoRescale|styleNoLabelNullNull0, -);
}

function 
BulkFillIDlistcolor )
{
    for( 
0; ( ID1 StrExtractIDlist) ) != ""+= )
    {
      
ID2 StrExtractIDlisti+);
      
FillSpaceID1,ID2color );
    }
}

// call function and refer to the assigned study ID's
BulkFill"L1,L2,RU,RL,R1,R2"colorRed )

Automatic support and resistance lines based on last HHV and LLV value

In this example we will present a method to plot automatic support and resistance lines based on recently hit highs/lows. In order to draw horizontal lines showing levels of recent HHV/LLV values and start drawing at the point of the chart, which defines given price level – we first need to identify the bar, where the line should start. This can be done with use of HHVBars / LLVBars functions.

These functions allow to find out the number of bars that have passed since our support or resistance level was established, so we could prevent from drawing the lines before these points.

This example shows how to draw support and resistance lines based on HHV/LLV levels:

// define reusable function
function SupResLevelsbarscolorUpColorDn )
{
   
bi BarIndex();
   
lvbi LastValuebi );

   
// return HHV value only for bars starting from the bar where HHV level was established
   
hv IIfbi >= lvbi LastValueHHVBarsHighbars ) ), LastValueHHVHighbars ) ), Null );

   
// the same approach for LLV
   
lv IIfbi >= lvbi LastValueLLVBarsLowbars ) ), LastValueLLVLowbars ) ), Null );

   
// plot levels
   
Plothv"hv"colorUpstyleDashed );
   
Plotlv"lv"ColorDnstyleDashed );
}

// price plot
PlotClose"Close"colorDefaultstyleBar );

// call function with various parameters
SupResLevels10colorGreencolorRed );
SupResLevels50colorGreencolorRed )

The chart below shows the output produced by the formula:

Automatic resistance/support levels

How to execute part of the formula only when new bar is added

In realtime conditions we may be interested in executing some parts of our formula only once per bar, when a new bar is created (e.g. for auto-trading purposes or just for notification). To do that – we would need to identify the very moment when new bar appears.

This can be done using static variables to record the timestamp of the most recent bar, then comparing current reading with the recorded value. Once the difference is detected – we can conditionally run our code and update the recorded time info.

Such an approach will work if we use timestamps that don’t change with each tick, so preferred option is to use Start Time of Interval for timestamp display (for daily and higher intervals we should unmark “override” box):

Intraday Settings

Then we can use the following code (this sample formula will just play a ding.wav system sound when the new bar is detected):

// read last bar date/time
lastBartime LastValueDateTime() );

// we use per-symbol variable
// you may consider to add GetChartID() key if you want
// to use the formula in multiple charts shown at the same time
varName Name() + "_lastdt";

// read recorded date/time from last execution
recordedTimestamp NzStaticVarGetvarName ) );

// code runs conditionally only when new bar is detected
if( lastBarTime != recordedTimestamp )
{
    
// record new bar datetime
    
StaticVarSetvarNamelastBartime );

    
//////////////////////////////////////
    // main code here
    
PlaySound"c:\\windows\\media\\ding.wav" );
    
//////////////////////////////////////
}

// sample indicator code
PlotClose"Close"colorDefaultstyleBar )

Newer AmiBroker versions (>5.60) can use this for reading last bar timestamp (this is faster than using DateTime() function).
lastBartime Status("lastbarend")

How to increase maximum periods of built-in indicators

Built-in indicators and averages which are shipped with AmiBroker use Param() function calls to provide the ability to adjust parameter values through Parameters window. Param function in the code specifies default, minimum, maximum values for the input arguments.

The order of arguments in Param function is the following:

Param"name"defaultvalminmaxstepsincr 

In certain situations, we may however want to use larger period settings than the pre-defined maximum. There is an easy way to adjust the code to achieve such task. Let us consider using built-in Price (all in one) indicator and setting e.g. 200 or 300 periods for Bollinger Bands (default maximum is 100).

To modify the underlying code, we need to:

  1. Click on the chart with right mouse button and choose Edit Formula from the context menu to bring up the AFL code editor
  2. In the code identify Bollinger Band section and the Param function call responsible for setting number of periods and change it from 200 to 300 as shown in the picture below.

    Param call

  3. Approve the changes, by selecting Tools->Apply from the editor’s menu

Now we can go back to Parameters dialog and we will be able to set Bollinger Bands Periods setting up to 300 periods.

How to browse charts in selected date range

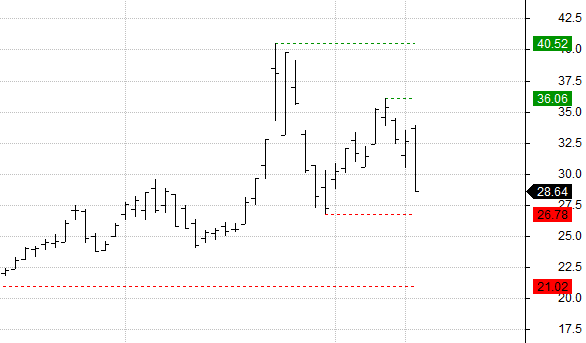
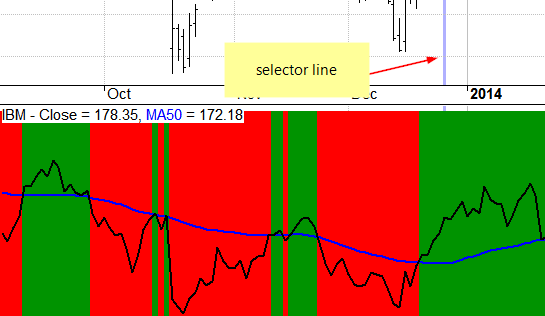
In order to select certain range of dates in the historical chart, then scroll through the history of tickers, we can mark the range of dates we interested in using Range Markers (double-click on the chart or mark the bars and hit F12, SHIFT+F12).

Range markers

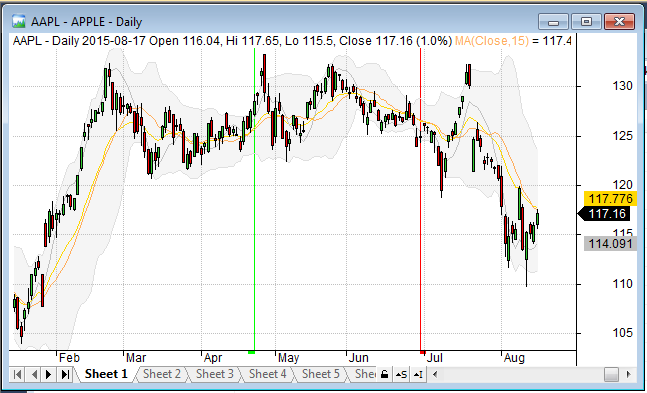
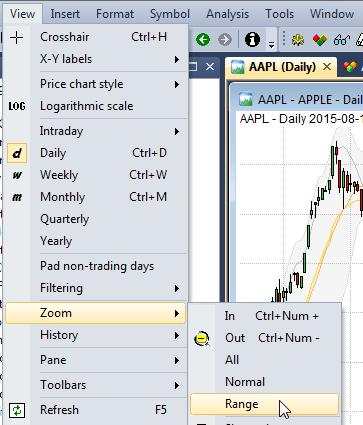
Then, use View->Zoom->Range menu to zoom the chart to our range selection.

Zoom to range

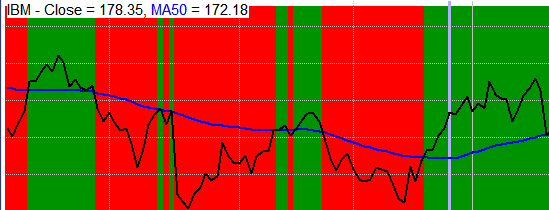
We can also assign a keyboard shortcut to View->Zoom->Range command or create a custom toolbar button to have it easily accessible (e.g. CTRL+SHIFT+R). This can be done in Tools->Customize (http://www.amibroker.com/guide/h_customizeui.html)

After we switch the symbol, in situations when the chart shifts e.g. due to different history length in those symbols – all we have to do is to hit CTRL+SHIFT+R to bring back the view to the range we wanted.

Browsing through the list of symbols can be automated further with scripts. Below is a sample auto-play script that will automatically browse through the list of symbols and will set the zoom to the dates we set in the code. All we need is just to start the script and watch it all switching automatically, without any manual actions required.

Here is a sample script that will browse through the list of symbols and set the zoom to show year 2010:

iWatchList 0/* you can define watch list number here */

AB = new ActiveXObject"Broker.Application" );
Qty AB.Stocks.Count;

for ( 
0Qtyi++ )
{
    
Stk AB.Stocks);

    if ( 
iWatchList 32 )
    {
        if ( 
Stk.WatchListBits & ( << iWatchList ) )
        {
            
AB.ActiveDocument.Name Stk.Ticker;
            
AW AB.ActiveWindow;
            
AW.ZoomToRange"2010-01-01""2011-01-01" );
            
WScript.Sleep2000 ); // 2 seconds delay
        
}
    }
    else
    {
        if ( 
Stk.WatchListBits2 & ( << ( iWatchList 32 ) ) )
        {
            
AB.ActiveDocument.Name Stk.Ticker;
            
AW AB.ActiveWindow;
            
AW.ZoomToRange"2010-01-01""2011-01-01" );
            
WScript.Sleep2000 ); // 2 seconds delay
        
}
    }

To use above code follow these steps:

  1. Open Notepad
  2. Copy-paste above the code
  3. Save the file with .JS extension (which means that system will treat this as JScript code)
  4. Make sure that AmiBroker is running with desired chart as active one
  5. Double click on .JS file to execute the JScript code

IMPORTANT: if you are running 64-bit Windows and have BOTH 32-bit and 64-bit versions of AmiBroker installed the OLE scripts by default would only talk to 64-bit instance. To use 32-bit version instead you would need to follow advice given in this article: http://www.amibroker.com/kb/2015/01/12/ole-automation-scripts-with-32-and-64-bit/

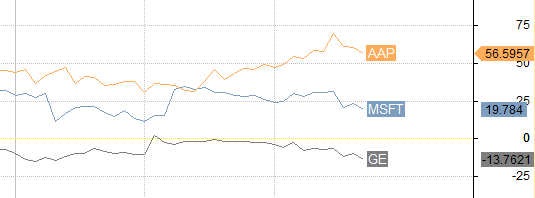
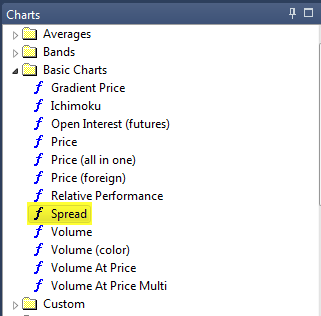
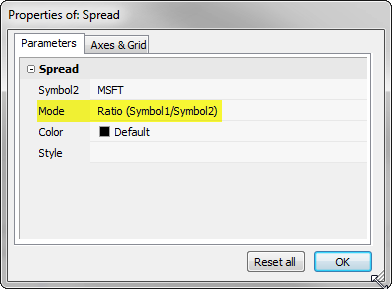
It is worth noting that going through series of charts is not the only way to compare performance of various symbols over time. There are other dedicated built tools for comparing several securities (without switching symbols, but within one chart window), including Price (Foreign) and Relative Performance indicator. These functionalities are shown in the following video:
http://www.amibroker.com/video/TwoSymbolsOneChart.html

How to move a window to another monitor

By default document windows like Charts, Analysis, Account Manager, Web Research all open inside of main AmiBroker frame window. In multi-monitor setups it may be useful however to move some of them to another screen.

Let us say we want to move Analysis window to second monitor screen. This can be done by switching the window to special “Floating” mode by using Window->Floating option from the menu after opening Analysis.

Window menu

Using floating mode detaches Analysis from the main frame and then the window can be moved outside of it.

Window menu

Exactly the same procedure works for Chart windows, Account Manager or Web Research windows.

The procedure (for chart window) has also been shown in this video:
http://www.amibroker.com/video/FloatAndLink.html

Positioning area plots behind the grid lines

When we want to paint the background with custom colors to indicate certain states or conditions – we can use area plots style for this purpose. The code example presented below shows green background when Close stays above 50-period moving average and red when below MA-50.

PlotClose"Close"colorDefaultstyleThick);
PlotMA50 MA(Close,50), "MA50"colorBluestyleThick);

color IIfClose MA50colorGreencolorRed );
Plot1""colorstyleArea|styleOwnScale,0,)

However – by default both grid lines and the selector line would get covered by the area plot:

area chart

There is an easy fix for that – AmiBroker allows to specify the Z-axis position too, so we can shift the visibility and order of plots (including their position against grids and other elements) by means of Z-order argument of Plot function.

If we specify the Z-order argument to -1 that means we move the particular plot one level behind and this would also be located below the grids.

PlotClose"Close"colorDefaultstyleThick);
PlotMA50 MA(Close,50), "MA50"colorBluestyleThick);

color IIfClose MA50colorGreencolorRed );
Plot1""colorstyleArea|styleOwnScale,0,1,0,-); // the 8th argument specifies z-orde

fixed z-order area chart

More information about use of Z-order can be found in the User’s Guide:
http://www.amibroker.com/guide/h_indbuilder2.html

How to add symbol labels to Relative Performance chart

The built-in Relative Performance chart displays symbol names colored respectively in the chart Title. However – it may be practical to display the symbol label next to the plotted line for easier identification. This can easily be done with PlotText or PlotTextSetFont function.

A sample code showing such modification is presented below. Font size of the labels can be changed through Parameters dialog.

_NTickerList ParamStr"Tickers""^DJI,MSFT,GE" ) );
fontsize Param("Label font size"10430);
fvb Status"firstvisiblebar" );

for( 
0; ( symbol StrExtractName() + "," TickerList) ) != ""i++ )
{
    
fc Foreignsymbol"C" );

    if( ! 
IsNullfc] ) )
    {
        
relP 100 * ( fc fcfvb ] ) / fcfvb ];
        
PlotrelP symbolcolor colorLightOrange + ( ( ) % 15 ), styleLine );

        
LastValueBarIndex() ) + 1;
        
LastValuerelP );

        
PlotTextSetFontsymbol"Arial"fontsizexyGetChartBkColor(), color, -fontsize/);
    }
}

PlotGrid0colorYellow );
_NTitle "{{NAME}} - Relative Performance [%]: {{VALUES}}" )

Relative Performance with labels

Next Page »