January 28, 2015
Why Analysis results and Chart output may differ
In general AFL functions return identical results when the input data and settings are the same, no matter if they are called from the chart formula or from Analysis window.
Therefore, when we observe differences in results obtained in the chart vs results in Analysis window out of the same code, we should check the following settings to make sure we indeed provide identical input to our formula.
First thing to check is the data interval used in the chart and in Analysis window – it needs to be identical
Chart: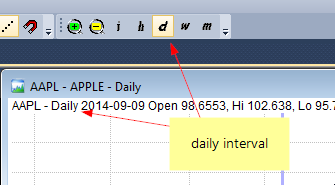
Analysis: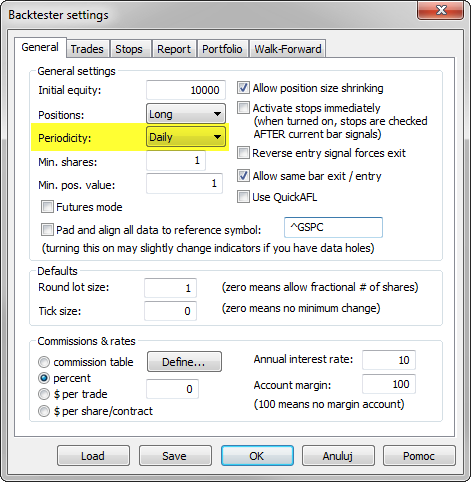
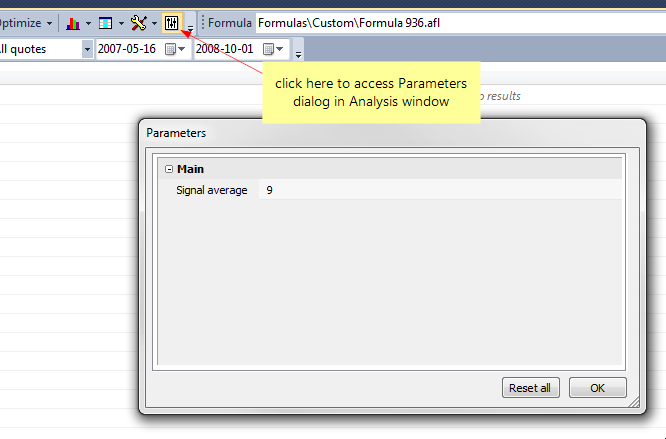
Second thing to check, is that if we use Param() function in the code – we need to remember that parameters are separate for Analysis window (Analysis module has ChartID equal to 0). Therefore – it is necessary to keep the parameter settings in sync:
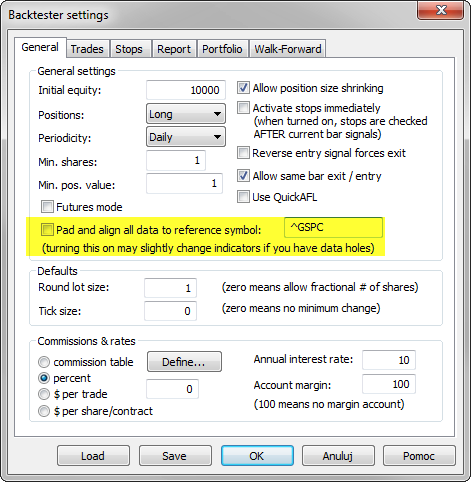
Third thing to check is the Pad and align data to reference symbol option that may affect input data for Analysis window calculations if there are differences in quotes or timestamps between the analysed ticker and the reference symbol, so unchecking this option may be required:
Last thing, is that if we calculate our indicators recursively in loops or use functions such as Cum() where results may depend on the number of loaded bars, then we also need to verify if e.g. chart zoom range makes any difference for our results in the chart.
AmiBroker uses its QuickAFL feature to optimize loaded data-range for best performance, however if our code is sensitive to a number of loaded bars, we may need to e.g. force loading certain number of historical bars with SetBarsRequired() function.
More information about QuickAFL can be found in the following KB article:
http://www.amibroker.com/kb/2008/07/03/quickafl/
 Filed by Tomasz Janeczko at 1:57 pm under Analysis
Comments Off on Why Analysis results and Chart output may differ