amibroker

HomeKnowledge Base

Text output in Explorations

Explorations allow to display not only numerical data but also text, there are however certain restrictions what can and can’t be displayed in the exploration result list as a text.

AddTextColumn() function allows to display strings, so we can use it for displaying e.g. full name of the symbol or category assignment information:

Filter 1;
AddTextColumnFullName(), "FullName");
AddTextColumnSectorID(1), "Sector");
AddTextColumnIndustryID(1), "Industry");
AddColumnClose"Close")

Exploration Text output

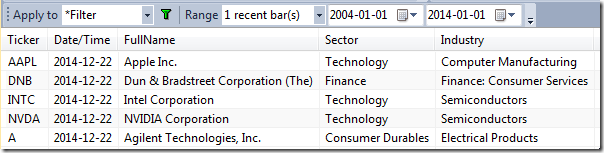
It is worthwhile to note that these strings displayed above do not vary across historical bars. That is important, because there is no such structure in AFL as an ‘array of strings’, therefore an attempt to generate a text, which varies on each bar will not work. Instead a string representing selected array value (or last value) will be displayed.

Let us check such a formula to illustrate the above statement:

condition Close Open;

Filter 1;
AddColumnOpen"Open" );
AddColumnClose"Close" );
AddColumncondition"Condition"1.0);

// WriteIf returns a SINGLE STRING representing condition at last bar of selected range
text WriteIfcondition"Close above Open""Close below Open" );
// the text variable represents value AT THE LAST BAR of selected range
AddTextColumntext"text" )

If we look at the output over more than one bar, then we can see that the condition from the last bar determines the text output in the column:

Exploration Text output

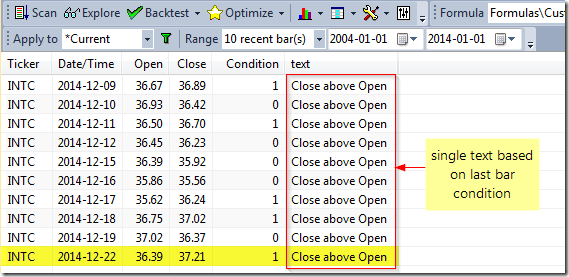
Therefore, such approach as above can only be used in situations where we run the exploration applied e.g. to 1-Recent bar, because it’s the last bar from the range which determines the text displayed in the column in such situation.

If you want to display the value for other bars than last bar of selected range, you need an extra column, like this:

condition Close Open;

Filter 1;
AddColumnOpen"Open" );
AddColumnClose"Close" );
AddColumncondition"Condition"1.0);

// WriteIf returns a SINGLE STRING representing condition at last bar of selected range
text WriteIfcondition"Close above Open""Close below Open" );
AddTextColumntext"Last bar text" ); 

// Note that we are now using Ref() function to reference previous bar data
text2 WriteIfRefcondition, -), "Close above Open""Close below Open" );
AddTextColumntext2"Previous bar text" )

You can use functions like Ref() or ValueWhen() to refer to other bar’s data, or you can use array subscript operator like this condition[ 1 ] to get value of condition at bar with index 1.

There is an alternative method to display values that change on bar by bar basis as letters though. Instead of displaying full string we can display single characters in a column using formatChar parameter, as shown in the code below:

Version5.90 ); // only works for version 5.90 and above
Buy CrossMACD(), Signal() );
Sell CrossSignal(), MACD() );

Filter Buy OR Sell;
AddColumnIIfBuy'B''S' ), "Signal"formatChar )

Exploration Text output

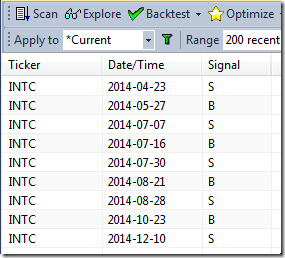
Note: If you are using version older than 5.90, you need to use Asc function instead of single-character literals, as shown below:

Buy Cross(MACD(),Signal());
Sell Cross(Signal(),MACD());

Filter Buy OR Sell;
AddColumnIIfBuyAsc("B"), Asc("S")), "Signal"formatChar )

More information about explorations can be found in the manual:
http://www.amibroker.com/guide/h_exploration.html

How to copy backtest trade list to a spreadsheet

There are several ways to transfer the backtest results to a spreadsheet.

  1. Immediately after the test we can just click on the results list with right mouse button and choose Copy from the menu. It is also possible to click on the results and use Ctrl+C key shortcut.

    Copy Trade List

    The operation will copy the entire list, so there is no need to select all rows manually.

  2. After the test, we can also use File->Export option from the main program menu to export the results list to a CSV or HTML file, which could be opened from Excel later on.

    Export Trade List

  3. Backtest results are also accessible through the Report Explorer:

    Backtest Report Explorer

    In order to open detailed report for the particular test it is enough to double-click on the selected line. Then, after we navigate to Trade List page, to copy the results, the best option to use is Edit->Copy Table

    Copy Table

    Unlike the regular Copy option, Copy Table transforms HTML tables into CSV format and copies it into clipboard so tables can be pasted easily to Excel. Also it divides Entry/Exit columns into separate Entry/exit date/price columns.

How to backtest symbols individually

By default, when we run backtest over a group or watchlist of symbols – AmiBroker will perform a portfolio test. However, there is also an Individual mode of the backtest available, where every symbol is tested individually and independently.

Once we send the formula to Analysis window and define group of symbols to run code on (Apply To), in order to run an individual backtest, it is necessary to unfold the menu next to Backtest button and choose Individual Backtest from the menu.

Individual Backtest

To get full report generated for each of the tests, it is required to first go to Analysis–>Settings->Report tab and mark Generate detailed reports for each symbol in individual backtests option.

Individual Backtest Report

Then the full reports can be accessed through the Report Explorer.

Report Explorer

The letter I indicates that the report contains results of an individual test. Double-clicking on the particular results line will show full contents of the backtest report.

Report Explorer List

How to display correlation between symbols

For the purpose of calculating the correlation between two data-arrays, there is a Correlation() function in AFL which can be used.

In order to display a correlation chart, please select Analysis–>Formula Editor menu and enter the following code:

SetChartOptions0chartShowArrows|chartShowDates);
Ticker ParamStr"Symbol"Name() );
range Param"Periods"25225001);

corr CorrelationCloseForeignTicker"C"), range );
Plotcorr"Correlation " Name() + "/" ticker,
      
ParamColor"Color"colorRed ), ParamStyle"Style"styleLine ) );

// check if different symbols are used
if( ticker == Name() )
    
Title "Please select different symbol from Parameter dialog"

Now select Tools->Apply Indicator. Initially the code will pick the selected symbol’s Close prices for both arrays, so we either need to change the selected ticker in the chart or the second symbol, which can be defined in Parameters dialog.

We can also use Exploration feature to display a correlation matrix e.g. for the watchlist members. The below example shows the process for Watchlist 0 members.

The formula to display correlation table looks as follows:
// read the list of symbols from Watchlist 0
symlist CategoryGetSymbolscategoryWatchlist);

// display only last bar from the Analysis range
Filter Status"lastbarinrange" );

// iterate through symbols
for ( 0; ( sym StrExtractsymlist) ) != ""i++ )
{
    
// calculate correlation over 252 bars
    
Corr CorrelationCForeignsym"C" ), 252 );

    
// set color dynamically based on correlation values
    // and display the output in exploration column
    
Clr 32 SelectedValueCorr ) * 32;
    
AddColumnCorrsym1.2,
               
ColorHSB128 Clr255255 ),
               
ColorHSBClr255255 ) );
}

SetSortColumns)

To use the formula we need to do the following:

  1. assign some symbols to watchlist 0
  2. select Analysis->Formula Editor menu
  3. in the AFL Editor enter the code listed above
  4. select Tools->Send to Analysis menu
  5. in the Analysis window, select Apply to: Filter (in Include tab hit Clear and pick watchlist 0)

    Filter dialog

  6. select Range: 1 Recent bar (in case of longer range, last bar of the range will be used for output)
  7. press Explore button

Here is a sample output table:

Correlation Matrix

Be careful and try not to put 10000 items in the watch list because it would need to create a table with 10K columns. Windows has some limits on pixel width of the list view and it would truncate display when the display width (scrollable area inside list) exceeds 32767 pixels. That makes it practical only to display matrices of not more than about 1000-2000 columns.

How to restrict trading to certain hours of the day

In order to include time-based conditions in the back-testing code – we can use TimeNum() function to check the time-stamp of given bar and use it as input for any time-based conditions.
http://www.amibroker.com/f?timenum

In order to code a strategy that triggers trades only in certain hours of the day, 9:30-11:00 in this example, we can use the following approach (code uses simple MACD crossovers to generate signals):

tn TimeNum();
startTime 93000// start in HHMMSS format
endTime 110000;  // end in HHMMSS format
timeOK tn >= startTime AND tn <= endTime;

Buy CrossMACD(), Signal() ) AND timeOK;
Sell CrossSignal(), MACD() ) AND timeOK

It is also possible to force an exit signal after 11:00 to avoid overnight positions:

tn TimeNum();
startTime 93000// start in HHMMSS format
endTime 110000;  // end in HHMMSS format
timeOK tn >= startTime AND tn <= endTime;

Buy CrossMACD(), Signal() ) AND timeOK;
Sell = (CrossSignal(), MACD() ) AND timeOK) OR CrosstnendTime ); 

How to synchronize backtesting setup on different computers

When comparing the output of back-tests obtained from different working machines, it is necessary to make sure that all aspects of our testing are identical, including:

  1. the database
  2. the formula used for testing
  3. the settings

In order to synchronize data – the best is to copy the entire local database folder. Using just the same data source, especially if it is real-time feed may not be enough due to different array lengths or some corrections that may have been applied in historical data on data-vendors server in between.

In case of any differences in results between two computers that is the very fist thing to check, as different input would result in different output.

To find out that the data are different you may simply create a checksum of data columns, using code like shown below:

Filter Status("lastbarinrange");
AddColumnCumHigh Low Close Open ), "Price checksum");
AddColumnCumVolume ), "Volume checksum" );
AddColumnBarIndex(), "Number of bars");
AddSummaryRows); // add total sum of column

By running this code on both computers you can compare checksums to see if they are the same.

In order to transfer the formula and settings to the other machine it is enough to:

  1. select Analysis window
  2. use File->Save from the main menu and save the APX file
  3. open the same APX file on the other computer

If data, code and settings are identical, then the obtained results will also stay in sync.

Handling limit orders in the backtester

In order to simulate limit orders in backtesting it is necessary to check in the code if Low price of the entry bar is below the limit price we want to use. The following example shows an entry signal based on Close price crossing over 100-period simple moving average. The position is opened on the next bar if price drops 1% below the Close of signal bar.

BuySignal CrossCloseMA(Close100 ) );

// buy on the next bar
Buy RefBuySignal, -1);
BuyLimitPrice RefClose, -1) * 0.99;

// now we check if limit was hit
Buy Buy AND BuyLimitPrice;

// if Open price is below the limit, then we use Open for entry
BuyPrice MinOpenBuyLimitPrice )

If we want the order to be valid for more than one bar, then we can use Hold function for this purpose:

BuySignal CrossCloseMA(Close100 ) );

// buy on the next bar
Buy RefBuySignal, -1);
BuyLimitPrice ValueWhen(BuySignalClose) * 0.99;

// now we check if limit was hit
Buy HoldBuy) AND BuyLimitPrice;

// if Open price is below the limit, then we use Open for entry
BuyPrice MinOpenBuyLimitPrice )

In a portfolio-level backtest we usually advocate against using limit orders. Why? Simply because we may not have enough cash in your account to place limit orders for all possible entry candidates. If your trading system generates 100 possible entries, you would need to place 100 limit orders only to find out that eventually only few of them fired. With limited buying power, we may need to place limit orders only for the top N-scored tickers that have generated BuySignal and skip the others. To simulate the situation when we only place small set of limit orders for top ranked stocks we can use new ranking functionalities introduced in AmiBroker 5.70. Knowing the rank at this stage is required if we only want to allow orders for top-scored tickers. Let us say that we prefer symbols with smallest RSI values.

The code would look the following way: Formula first generates a ranking for all tickers included in the test (below example uses Watchlist 0), then when testing individual symbols – checks the pre-calculated rank and generates Buy signal based on that reading.

// we run the code on WatchList 0
List = CategoryGetSymbolscategoryWatchlist);
SetOption("MaxOpenPositions"3);

if ( 
Status("stocknum") == // Generate ranking when we are on the very first symbol
{
     
StaticVarRemove"values*" );

     for ( 
0; ( Symbol StrExtract( List, ) )  != "";  n++    )
     {
         
SetForeign symbol );

         
// value used for scoring
         
values 100 RSI();
         
RestorePriceArrays();
         
StaticVarSet (  "values"  +  symbolvalues );
         
_TRACEsymbol );
     }

     
StaticVarGenerateRanks"rank""values"01224 );
}

symbol Name();
values StaticVarGet "values" +  symbol );
rank StaticVarGet "rankvalues" +  symbol );

PositionScore values;

BuySignal CrossCloseMA(Close100 ) );

// buy on the next bar
Buy RefBuySignal, -1);
BuyLimitPrice RefClose, -1) * 0.999;

// now we check if limit was hit for the symbols ranked as top 3
Buy Buy AND BuyLimitPrice AND rank <= 3;
BuyPrice MinOpenBuyLimitPrice );

// sample exit rules - 5 - bar stop
Sell 0;
ApplyStopstopTypeNBarstopModeBars51)

Detailed description of the ranking functionality used above is available in the manual at: http://www.amibroker.com/guide/h_ranking.html

How to display indicator values in the backtest trade list

Backtesting engine in AmiBroker allows to add custom metrics to the report, both in the summary report and in the trade list. This is possible with Custom Backtester Interface, which allows to modify the execution of portfolio-level phase of the test and (among many other features) adjust report generation.

Due to the fact that the report generation occurs in 2nd phase of the test, when the backtester works on ~~~EQUITY ticker, we can not refer directly to given indicators. For example, to display ATR values – calling ATR() function directly is not enough, because we want to see ATR values of the traded symbol, while in portfolio-phase of the test we are no longer working on that symbol’s quotes.

So, we need to:

  1. store the values of indicators in static variables in the 1st phase of the test (when individual symbols are processed). This can be done with static variables, creating separate static variable for each symbol
  2. read stored values once the backtester reaches the portfolio phase of the test.

The following formula shows how this can be coded. The formula below displays the value of ATR indicator for the entry bar of given trade:

SetCustomBacktestProc"" );

if ( 
Status"action" ) == actionPortfolio )
{
    
bo GetBacktesterObject();
    
// run default backtest procedure without generating the trade list
    
bo.BacktestTrue );

    
// iterate through closed trades
    
for ( trade bo.GetFirstTrade( ); tradetrade bo.GetNextTrade( ) )
    {
        
// read ATR values and display as custom metric
        
symbolATR StaticVarGettrade.Symbol "ATR" );
        
trade.AddCustomMetric"Entry ATR"LookupsymbolATRtrade.EntryDateTime ) );
    }

    
// iterate through open positions
    
for ( trade bo.GetFirstOpenPos( ); tradetrade bo.GetNextOpenPos( ) )
    {
        
// read ATR values and display as custom metric
        
symbolATR StaticVarGettrade.Symbol "ATR" );
        
trade.AddCustomMetric"Entry ATR"LookupsymbolATRtrade.EntryDateTime ) );
    }

    
// generate trade list
    
bo.ListTrades( );
}

// your trading system here
Buy CrossMACD(), Signal() );
Sell CrossSignal(), MACD() );

// assign indicator values to ticker-specific variables
StaticVarSetName() + "ATR"ATR15 ) )

How to export quotes to separate text files per symbol

The following KB article: http://www.amibroker.com/kb/2006/03/04/how-to-export-quotations-from-amibroker-to-csv-file/ already explained how to use exploration to export quotes into a single text / CSV file.

If, for some reason, we need individual files for each symbol, AmiBroker offers another way of writing data to text files. This can be achieved by using fputs function that would write directly to external files. Using fputs allows us also to fully control formatting of the output data and file naming can be dynamically set based on Name() function output.

To perform the export procedure, we need to run a Scan over the list of symbols we want to export data for.

In the Analysis->Formula Editor please enter the following code:

// create folder for exporting purposes
fmkdir"C:\\DataExport\\" );

// open file for writing
// file name depends on currently processed ticker
fh fopen"c:\\DataExport\\" Name() + ".txt""w" );

// proceed if file handle is correct
if ( fh )
{
    
dt DateTime();

    
// write header line
    
fputs"Ticker,Date/Time,Open,High,Low,Close,Volume\n"fh );

    
// iterate through all the bars

    
for ( 0BarCounti++ )
    {
        
// write ticker name
        
fputsName() + "," fh );

        
// write date/time information
        
fputsDateTimeToStrdt] ) + ","fh );

        
//write quotations and go to the next line
        
qs StrFormat"%g,%g,%g,%g,%g\n"O], H], L], C], V] );
        
fputsqsfh );

    }
    
// close file handle
    
fclosefh );
}
 
// line required by SCAN option
Buy 0

Now please select Tools->Send to Analysis, select the list of symbols (e.g. Apply To: Filter, pick the watchlist in the Filter dialog), set Range to All Quotations, and press Scan

How to add exploration results to a watchlist

In order to add analysis results to a selected watchlist manually, we can use context menu from the results list:

Add results to watch list

There is, however, a way to automate this process and add the symbols to a watchlist directly from the code. To do so, we need to:
– check if our Filter variable was true at least once in the tested Analysis range
– based on the above condition, use CategoryAddSymbol() function to add tickers to a watchlist.

Additionally, we can erase the watchlist at the beginning of the test if we want to store just the new results.

The code below shows how to implement this procedure in AFL.

listnum 10// we use watchlist 10 for storing results

// erase the watchlist when we process very first symbol
if ( Status"stocknum" ) == )
{
    
// retrieve watchlist members
    
oldlist CategoryGetSymbolscategoryWatchlistlistnum );

    
// iterate through the list and remove tickers
    
for ( 0; ( sym StrExtractoldlist) ) != ""i++ )
    {
        
CategoryRemoveSymbolsymcategoryWatchlistlistnum );
    }
}

// sample exploration code
Filter ROCClose) > AND Volume 1000000;
AddColumnClose"Close" );
AddColumnROCClose), "ROC" );
AddColumnVolume"Volume" );

// check how many times Filter variable was true in the tested range
// if non-zero value detected, add current symbol to a watchlist
if ( LastValueCumFilter AND Status"barinrange" ) ) )  )
    
CategoryAddSymbol""categoryWatchlistlistnum )
« Previous PageNext Page »