November 3, 2014
How to sync a chart with the Analysis window
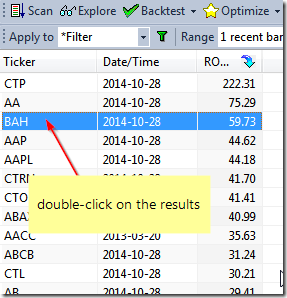
When we want to sync a chart with the selected symbol in the Analysis results list, it is enough just to double-click on the particular line in the list and AmiBroker will automatically switch the selected symbol and interval to match the Analysis window.

Additionally, when we browse through Scan or Backtest results, double-clicking would be an equivalent of Show arrows for all raw signals option from the context menu and would display trading arrows in the chart to match the signals generated by the formula.
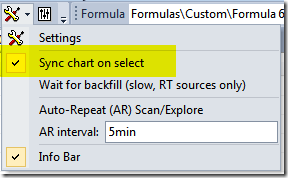
If we find that double-clicking is too much work, it is possible to mark Sync chart on select option in Analysis window settings menu:

and then single click to select a chart is enough to sync the symbol in the chart. This also allows to use keyboard (up/down cursor keys) to change the selection and sync automatically.
When we have more than one chart window displayed, then Analysis window will always sync the last opened chart window.
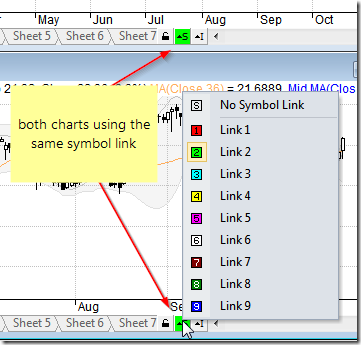
If we want to sync multiple chart windows we can use Symbol Link feature. Once multiple windows have the same “Symbol Link” color selected, browsing through the results list in Analysis automatically will automatically sync all linked chart windows (e.g. for the purpose of showing different intervals in each of the charts).

More information about chart link functionality is available in tutorials at:
http://www.amibroker.com/guide/h_sheets.html. See also video tutorial showing how to use symbol linking: http://www.amibroker.com/video/FloatAndLink.html
 Filed by Tomasz Janeczko at 7:39 pm under Charting
Comments Off on How to sync a chart with the Analysis window