amibroker

HomeKnowledge Base

How to hide unused categories

AmiBroker categories offer 256 Markets, 256 Groups, 256 industries grouped within 64 sectors, plus unlimited number of watchlist (and support for other categorization standards such as ICB and GICS).

By default all markets, groups, sectors and industries are displayed, even if no symbol is assigned to them (so they are “empty”).

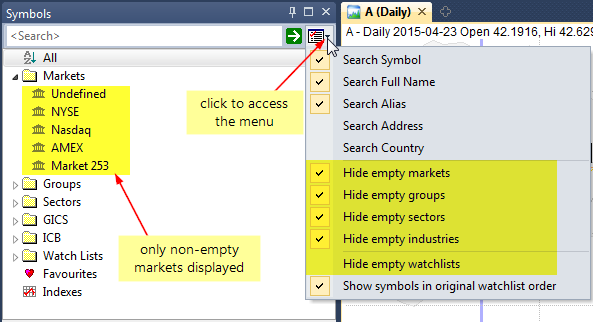
Hide categories

To avoid showing all the categories in Symbols window tree, we can use one of Hide empty markets/groups/sectors/industries/watchlists options available in the menu in Symbols window:

Hide categories

Now the list of categories shows only those, which contain at least one symbol and empty ones are omitted. More information about categories in AmiBroker can be found in the following chapter of the User’s Guide: http://www.amibroker.com/guide/h_categories.html

How to fix outdated web research links

Built-in Web Research window allows to browse symbol-related websites based on the active symbol selected in AmiBroker, so navigation is much more convenient than searching for symbols in regular web-browser. The following tutorial chapter explains this functionality in details: http://www.amibroker.com/guide/h_webresearch.html

Since AmiBroker stores pre-defined link templates, there is a possibility that given website changes the structure of their addresses and that would also require us to modify the link templates in AmiBroker configuration to match new website structure.

When the Web research window shows error 404 or other message indicating that the address may not be correct, then we would need to perform the following actions (this example discusses changes at MarketWatch).

First we need to check for a sample symbol’s web page directly at given website to see what address is being used. Let us search for AAPL and MSFT symbols profile at MarketWatch. The addresses are the following:

http://www.marketwatch.com/investing/stock/msft/profile
http://www.marketwatch.com/investing/stock/aapl/profile

Therefore, if we want AmiBroker to place the selected ticker name in the link, then we need to define the following template:

http://www.marketwatch.com/investing/stock/{t}/profile

{t} item in the above address evaluates to the ticker symbol based on our selection in the program.

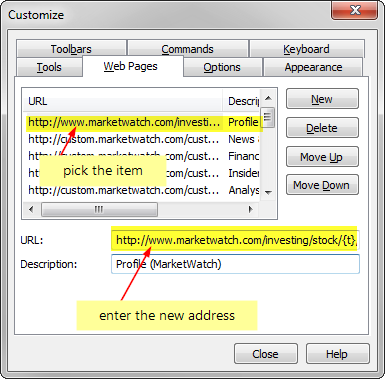
After that, we need to check what is the pre-defined template stored in Tools->Customize->Web Pages. If it is different than the link structure currently used at MarketWatch, then we need to update the stored address with the template shown above. The difference would mean that the website structure has changed since the link templates were added to AmiBroker configuration.

Customization dialog

Now the modified Profile page links match Marketwatch website and the company profile will work correctly in Web Research window.

How to restore program menus and/or toolbars

If we unintentionally make some changes to our toolbars or main menu using customization option, there is an easy way to restore the toolbars and menus to the default settings.

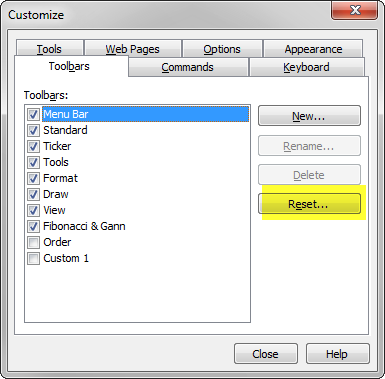
All we have to do is to select Tools->Customize menu, then in the Toolbars tab of the Customize dialog, click on the item we want to restore and press Reset button.

Reset toolbar

If any toolbar is missing, please verify if it has a checkmark switched on in the list shown above.

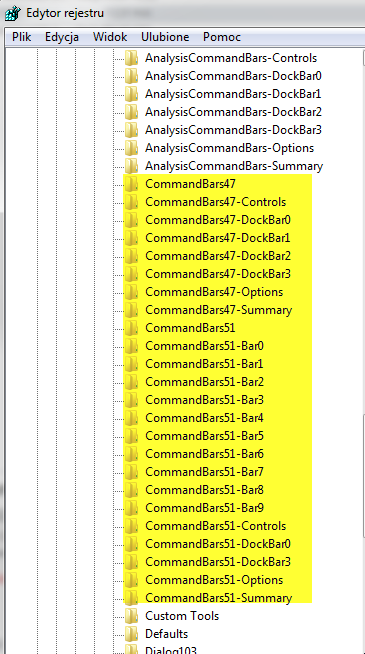
If all of this does not help and the toolbar and/or menu are still missing, then we can reset the position of all toolbars by using REGEDIT tool and removing all entries responsible for toolbar positions. The procedure is the following:

  1. exit AmiBroker
  2. use REGEDIT tool to edit the system registry (Windows Start->Run / type in: regedit )
  3. delete all entries starting with:
    HKEY_CURRENT_USER\Software\TJP\Broker\CommandBars
    

    as presented in the picture below

Reset toolbar

How to move a window to another monitor

By default document windows like Charts, Analysis, Account Manager, Web Research all open inside of main AmiBroker frame window. In multi-monitor setups it may be useful however to move some of them to another screen.

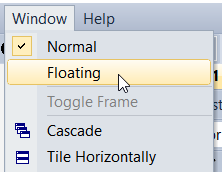
Let us say we want to move Analysis window to second monitor screen. This can be done by switching the window to special “Floating” mode by using Window->Floating option from the menu after opening Analysis.

Window menu

Using floating mode detaches Analysis from the main frame and then the window can be moved outside of it.

Window menu

Exactly the same procedure works for Chart windows, Account Manager or Web Research windows.

The procedure (for chart window) has also been shown in this video:
http://www.amibroker.com/video/FloatAndLink.html

Timestamps explained

When AmiBroker is fed with the data, say 1-minute data, it can create all other time intervals by compressing source data on-the-fly. So if you display say 13-minute chart, AmiBroker takes source 1-minute data and builds 13-minute blocks of data to create 13-minute bars. For this process to work correctly, source data need to have timestamps that point to the START of each bar interval. So with 1-minute data, the bar that has a timestamp 9:30:00 is supposed to cover trades from the period of 9:30:00.000 upto 9:30:59.999. All our data plugins provide data in that format.

Now, provided that we have say 1-minute data, AmiBroker can compress data to any other N-minute interval. When doing so, it can assign timestamps to compressed bars in different ways. This can be controlled through Tools->Preferences->Intraday dialog.
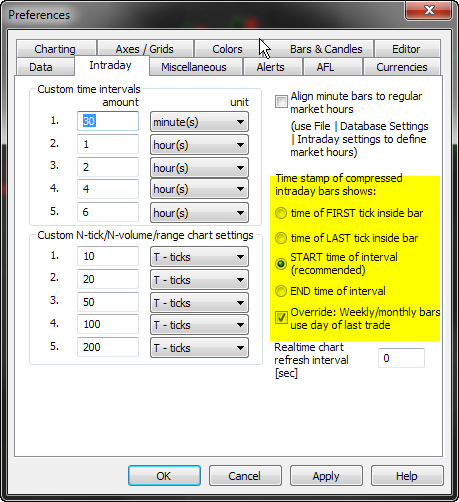
Timestamps

Let us check it on an example of a 5-minute bar based on input 1-minute quotes for e-mini contract.
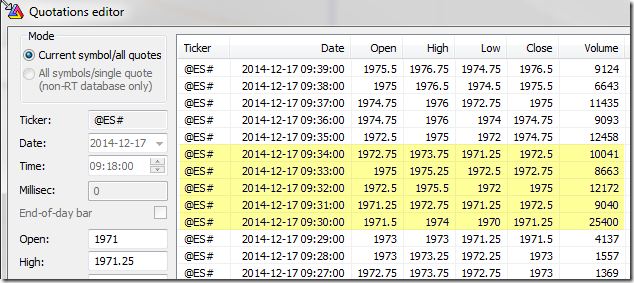
Timestamps

As explained in the manual (http://www.amibroker.com/guide/w_preferences.html) – there are four choices available:

  1. Time of FIRST tick inside bar – when selected the bar gets the time stamp of the very first trade inside given time slot (bar). With this choice the bar will be stamped with 9:30:00 because this is the first tick (quote) available within that 5-min period
  2. Time of the LAST tick inside bar – when selected the bar gets the time stamp of the very last trade inside given time slot (bar). In this case the bar will be stamped with 9:34:00 because this is the last quote available within that 5-min period
  3. START time of the interval – when selected the bar is time-stamped with start time of the time slot (bar). The bar will be stamped with 9:30:00 because that is a beginning of the selected time period.
    NOTE: This is recommended and the default setting as it provides consistency with how source bars are timestamped. It should not be changed unless you have really good reason to do so.

  4. END time of the interval – when selected the bar is time-stamped with start time of the time slot (bar). The bar will be stamped with 9:34:59 timestamp, because that’s the very end of this 5-min period.

There is also an additional setting available (Override: Weekly/monthly bars use day of last trade), which allow to modify the behaviour in case of Weekly/Monhtly bars, no matter what is the main setting we use. This allows us to e.g. use START time of interval to identify intraday quotes, however – on a weekly chart display e.g. Wednesday date (if that is most recent day in current week) or Friday date for complete weeks.

We need to remember that the timestamps identify the whole bar and all trades within that bar, so if we use START time of interval for time-stamping, in the backtest use Close array for as BuyPrice and 5-minute periodicity, then in our report we will see:

Timestamps

So, we see the time 9:30:00, but this bar refers to trading activity from period 9:30:00-9:34:59 and the actual price is read from the tick being the Close of the whole 5-minute period (at 9:34:00 in the table above).

For the same reason – when we use weekly data for backtesting, we trade at Open, but for time-stamps we use Override box (so weekly bars are stamped with the data of the last day within given week) – then in the report we will see e.g. Friday dates because of the fact that we use such approach to time-stamp bars. This does not really mean that trade happened on Friday, but only that we use Friday date to identify the whole Monday-to-Friday week.
How to increase font size for UI elements

In order to change / increase font size used for AmiBroker user interface elements, we can choose one of the following solutions:

  1. Set higher DPI in Windows Control Panel, or
  2. Set font size for individual UI elements such as list views using Windows Control Panel,

To set higher DPI in Windows Control Panel, follow the instructions below.

If you are using Windows 7 or Windows 8:

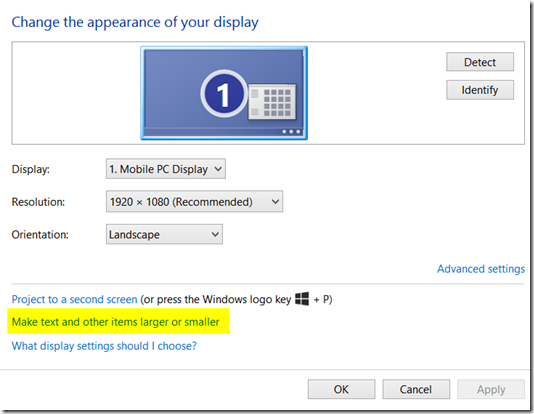
Open Screen Resolution by clicking the Start button, clicking Control Panel, and then under Appearance and Personalization, click Adjust screen resolution. Then click Make text and other elements larger or smaller

Control Panel

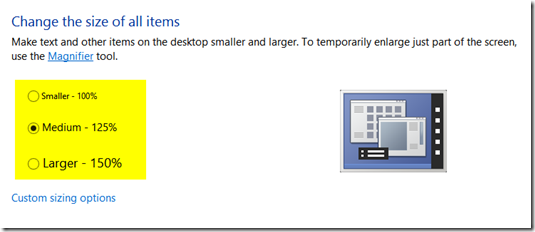
Now set the size of fonts choosing Medium or Larger in order to increase fonts globally.

Control Panel

For Windows XP – please follow the Microsoft documentation presented here:
https://www.microsoft.com/resources/documentation/windows/xp/all/proddocs/en-us/display_use_large_or_small_fonts.mspx?mfr=true

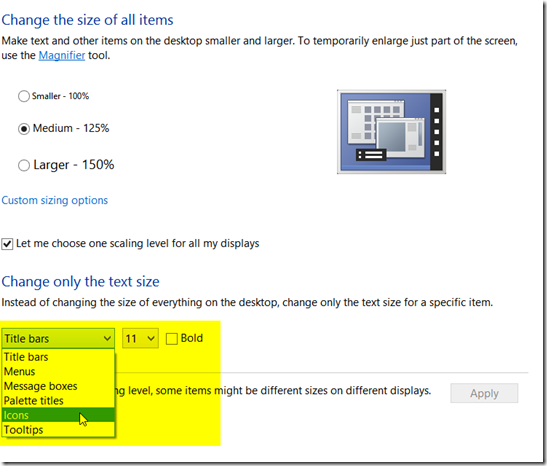
It is also possible to avoid changing all fonts globally and enlarge fonts e.g. for list views only. This can be done by adjusting the default icon system font in Control Panel.

If you are using Windows 8:

the Icon font can be changed in the same dialog as DPI settings discussed previously:

Control Panel

If you are using Windows 7:

In order to access the respective dialog – click on the desktop area with right-mouse button, click Personalize in the context menu, click on Window Color, then click on Advanced appearance settings option at the bottom.

Alternatively, navigate to Control Panel and in the search field in the top-right corner enter ‘window color’ – then pick Change window colors and metrics from the search results.

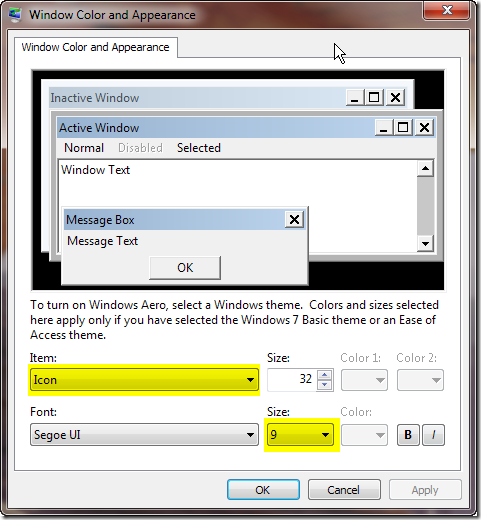
Then adjust Icon font in the Window Color and Appearance window as shown below:

Window Color and Appearance

For Windows XP – the procedure to get to the dialog is explained here:
http://windows.microsoft.com/en-us/windows-xp/help/setup/personalize-windows-xp

Finally, if we just want to change fonts used by the charts, i.e. X/Y axis, Title and text tool font – it is definable directly in Tools->Preferences->Miscellaneous, Axis font field.

If we want to change AFL Formula Editor font, it can be set in Tools–>Preferences–>Editor page.

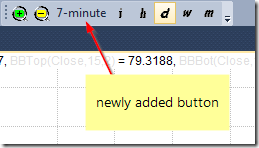
How to create toolbar button for custom interval

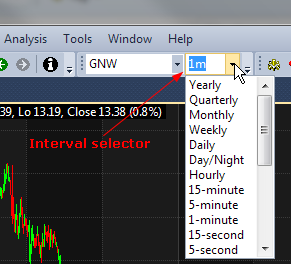
IMPORTANT NOTE: Before you add toolbar buttons for dozens of intervals please note that any interval can be picked from Interval Selector combo-box. If given interval is not present, you can just type it: 7m means 7-minute, 3h means 3-hour, 2D is 2-day), as shown below:

Custom time intervals

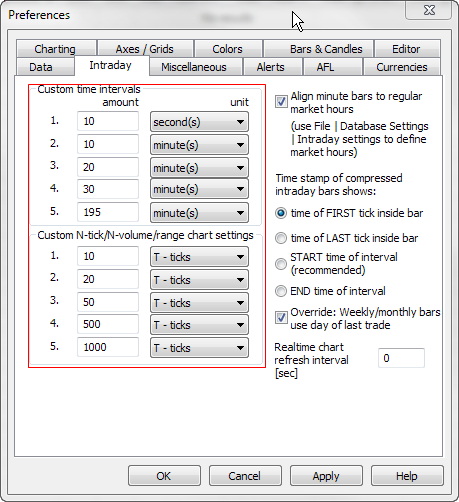
In order to add custom time-interval buttons onto the toolbar we first need to define our custom intervals in Tools->Preferences->Intraday:

Custom time intervals

Now, in order to customize the toolbar go to Tools-> Customize menu. That switches AmiBroker into special customization mode.

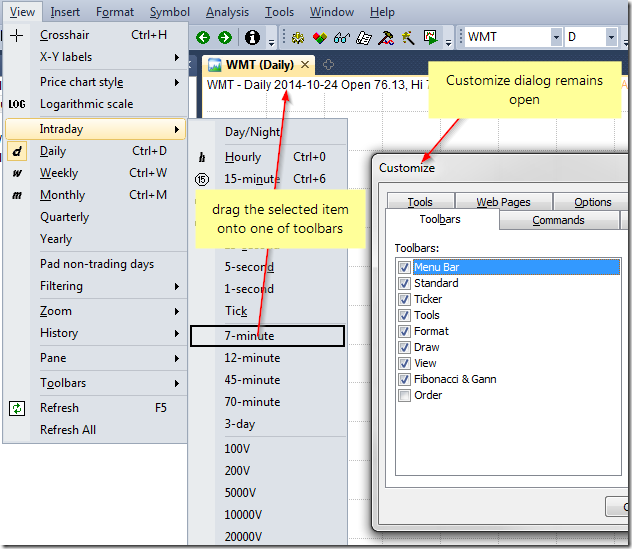
Now, while keeping the customize dialog open, we can just go to View->Intraday menu and pick the items we need, then start dragging it with the mouse cursor to the toolbar of our choice.

Custom time intervals

If we keep holding down CTRL key while dragging the items, a copy will be created on the toolbar, so the items will not be removed from the original menu.

Custom time intervals

It is also possible to replace the default text-description with a button image. This is further explained in the manual:
http://www.amibroker.com/guide/h_customizeui.html

How to create your own code snippet

AmiBroker 5.84 (released today) offers users an easy way to create their own code snippets. Code snippet is a small piece of re-usable AFL code. AmiBroker comes with lots of pre-defined snippets. You can learn more about built-in snippets here.

But now you can add your own! And it is fairly easy using new Code Snippet window. Code Snippets window is available in new AFL editor (in floating frame mode). It can be shown/hidden using Window menu.

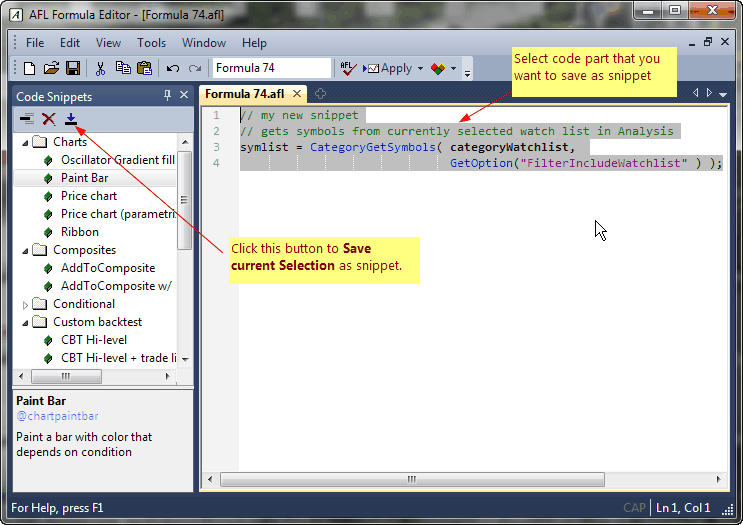
To create your own snippet, do the following:

  1. type the code you want
  2. select (mark) the code you want to place in a snippet
  3. press Save selection as snippet button in the Code Snippets window

Code Snippets 1

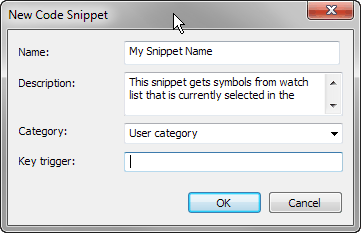
If you do the steps above the following dialog will appear:

Code Snippets 2

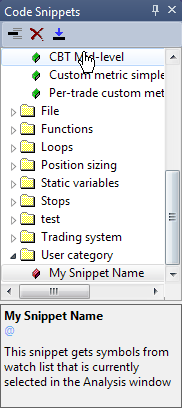
Now you need to enter the Name of the snippet, the Description and Category. Category can be selected from already existing items (using drop down box), or new category name can be typed in the category field. Key trigger field is optional and contains snippet auto-complete trigger (to be implemented later). Once you enter all fields and press OK, your new snippet will appear in the list.

Code Snippets 3

From then on you can use your own snippet the same way as existing snippets. Perhaps most convenient method is using drag-drop from the list to AFL editor.

As you may have noticed user-defined snippets are marked with red color box in the Code Snippets list. Only user-defined snippets can be overwritten and/or deleted. To overwrite existing user-defined snippet, simply follow the steps above and give existing name. AmiBroker will ask then if you want to overwrite existing snippet. To delete a snippet, select the snippet you want to delete from the list and press Delete (X) button in the Code Snippet window.

Make icons larger on high DPI displays

When running AmiBroker on high-DPI displays like Retina screens, 4K screens or small tablets with hi-res displays the toolbar icons may become so small that they are difficult to use.

To solve the problem you need to choose Tools->Customize menu to display Customize dialog, go to Options tab and
select Large Icons check box as shown in the picture below.

Options page, Large Icons

How to make vertical selection line thinner

AmiBroker 4.90 now has thick vertical selector line that plots behind chart lines to improve clarity and readability (selector does not cover candlesticks). Some users however prefer thin, single-pixel line. There is an easy way to switch. (more…)