April 20, 2016
Calling custom user functions in our code
AFL language allows us to define reusable functions that can be used in our formulas. The following chapter of the manual explains the procedure in details: http://amibroker.com/guide/a_userfunctions.html
When we want to call such function in our formula, we should add function definition into our code, so AmiBroker could identify and interpret custom keyword properly. Consequently, if we use the function in multiple chart panes, each of the formulas should contain the function definition first.
// custom function definition
function myMACD( array, fast, slow )
{
   return EMA( array, fast ) - EMA( array, slow );
}

// use of function
Plot( myMACD( High, 12, 26 ), "Open MACD", colorRed )
Since we may potentially define a large group of our own functions, pasting the definitions manually may not be very convenient. To avoid that, we can use #include statement and group our definitions in a separate AFL file which will be called with a single statement from our main code.
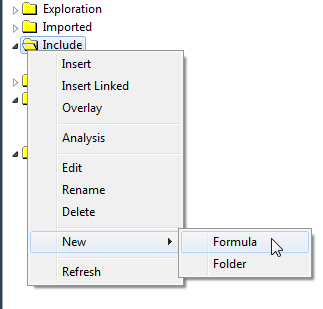
To create such file we should do the following:
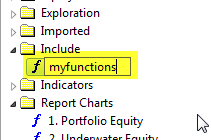
- Create a new formula. The preferred location is in Include folder in chart windows, we can in fact choose any custom location of the file.
- We can also rename the file to a descriptive name, for example myfunctions.afl:
- Now we can edit the file and paste our function definitions, then save the file:
function myMACD( array, fast, slow )
{
return EMA( array, fast ) - EMA( array, slow ); - Now in our main file we can use only a reference to myfunctions.afl file:
// include our definitions
#include <myfunctions.afl>

// use of function
Plot( myMACD( High, 12, 26 ), "Open MACD", colorRed
We don’t have to specify the path, because we saved our formula in the folder, which is specified as a ‘default include path’ in Tools–>Preferences–>AFL:
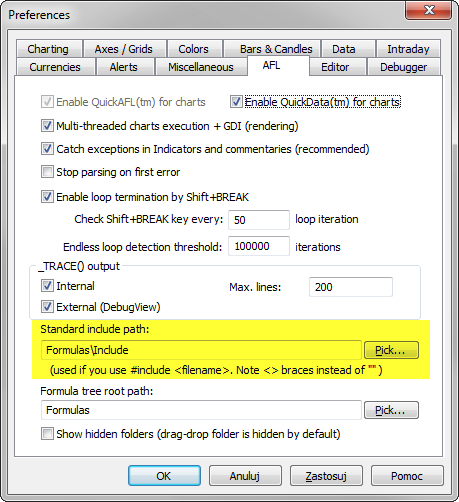
In other cases we should provide full path to the file – #include is a pre-processor command, therefore this time we use single backslashes in the path:
#include “C:\Program Files\AmiBroker\AFL\common.afl”
More information about include command can be found at:
http://www.amibroker.com/guide/afl/_include.html
 Filed by Tomasz Janeczko at 9:02 pm under AFL
Comments Off on Calling custom user functions in our code