amibroker

HomeKnowledge Base

How to use custom backtest metric as an optimization target

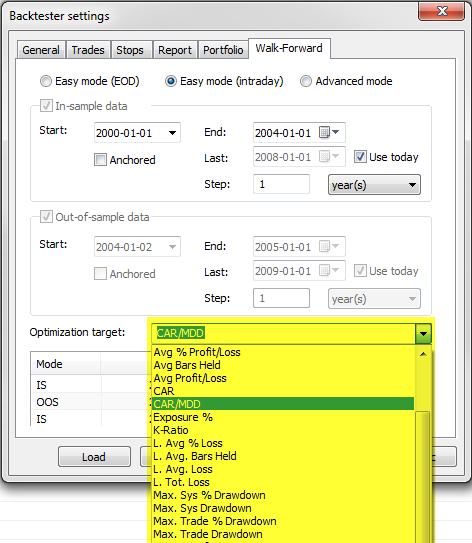
In Optimization and Walk Forward testing AmiBroker allows us to choose the optimization target that determines optimum values of optimized parameters. This can be done in Analysis->Settings->Walk Forward tab and the drop down list contains a list of built-in statistics to choose from:

Walk forward settings

However, we are not limited to built-in metrics only. Custom Backtester Interface allows us to add any custom statistics to the backtest/optimization reports and we can use these metrics for optimization too.

To do that, we first need to add a custom metric (this article explains how to do it: http://www.amibroker.com/guide/a_custommetrics.html). Then – we need to type-in our metric name into the Optimization Target box:

Walk forward settings - custom metric

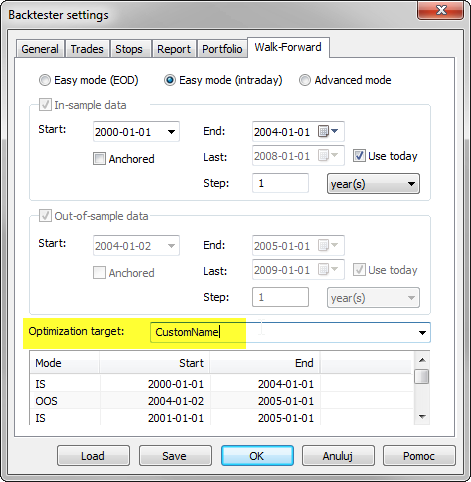
The name we enter must be an exact match of the metric name we have defined in AddCustomMetric() method. If entered name can not be found in the Optimization result table, then Net Profit will be used instead.

Importing auxilliary data into AmiBroker database

AmiBroker database structure offers the following fields: Open, High, Low, Close, Volume, OpenInt, Aux1, Aux2. The last two fields, i.e. Aux1 and Aux2 are meant for storing any custom historical data-arrays we may need.

Pretty often, we already have quotations data present in the database and we just want to put some extra data into auxiliary fields. To combine existing data with imported data, we can need to use hybrid mode. In the Import Wizard just add this command in “Additional commands’ field.

# This example assumes that file has format: 
# Symbol, Year-Month-Day, auxiliary_data1, auxiliary_data2
$FORMAT Name, Date_YMD, Aux1, Aux2
$HYBRID 1
$ALLOWNEG 1

Hybrid mode works so that with each imported record it looks for matching record in the database and it combines existing data with data being imported. If OHLC prices are not provided in the imported file you need to specify $ALLOWNEG 1 option. Otherwise you would get error messages about missing close price.

Auxiliary data fields can then be read using simply Aux1 and Aux2 identifiers:

PlotAux1"Aux1"colorRed )

However – if two additional fields are not enough for our purposes, we can also import quotes into some synthetic tickers and have another set of OHLC, V, OI, Aux1 and Aux2 fields available for importing. Synthetic ticker in this context means just a custom symbol name that’s used just for storing such extra data. So – instead of importing additional arrays into IBM ticker or AAPL ticker, we could use for example IBM_extra and AAPL_extra symbols and their fields.

Using such common naming pattern (i.e. identical ‘_extra’ suffix with the original ticker name) will be useful, because later on to access data from the selected field we could use just the following AFL call:

myVal ForeignName() +"_extra""C")

and this line will read value from Close field of the respective ‘extra’ ticker as we select IBM or AAPL.

An alternative way to store and handle several custom arrays would be to use SQL database, then we could use ODBC plugin to read such data. The documentation of ODBC plugin is available at:

http://www.amibroker.com/odbc.html

Why Analysis results and Chart output may differ

In general AFL functions return identical results when the input data and settings are the same, no matter if they are called from the chart formula or from Analysis window.

Therefore, when we observe differences in results obtained in the chart vs results in Analysis window out of the same code, we should check the following settings to make sure we indeed provide identical input to our formula.

First thing to check is the data interval used in the chart and in Analysis window – it needs to be identical

Chart:
Chart periodicity

Analysis:
Analysis periodicity

Second thing to check, is that if we use Param() function in the code – we need to remember that parameters are separate for Analysis window (Analysis module has ChartID equal to 0). Therefore – it is necessary to keep the parameter settings in sync:

Parameters in Analysis window

Third thing to check is the Pad and align data to reference symbol option that may affect input data for Analysis window calculations if there are differences in quotes or timestamps between the analysed ticker and the reference symbol, so unchecking this option may be required:

Pad And Align in Analysis window

Last thing, is that if we calculate our indicators recursively in loops or use functions such as Cum() where results may depend on the number of loaded bars, then we also need to verify if e.g. chart zoom range makes any difference for our results in the chart.

AmiBroker uses its QuickAFL feature to optimize loaded data-range for best performance, however if our code is sensitive to a number of loaded bars, we may need to e.g. force loading certain number of historical bars with SetBarsRequired() function.

More information about QuickAFL can be found in the following KB article:
http://www.amibroker.com/kb/2008/07/03/quickafl/

Detecting N-th occurrence of a condition using modulus operator

Modulus (%) is an operator that returns the reminder from integer division. It is very helpful to create counters that wrap-around at user-specified N.

In order to define a condition, which returns True every Nth bar, the easiest way is just to use % (modulus) operator. If we apply modulus to consecutive numbers such as BarIndex() – then calculating the reminder from integer division of barindex by N will return 0 every Nth bar (on bars that are divisible by N). We can use the following exploration to demonstrate that:

7;
bi BarIndex();
condition bi == 0;

Filter 1;
AddColumnbi"BarIndex");
AddColumnbi "Div by 7 remainder ");
AddColumnIIFcondition'T''F' ), "Condition",
           
formatCharcolorDefaultIIfconditioncolorYellowcolorDefault ) )

Modulus 1

Since the remainder from division by 7 will equal zero only for the multiples of 7, then we will have our condition True every 7th bar (as marked in the above exploration results with T letter on yellow background).

Using the same technique we can also count occurrences of certain criteria and then apply the % operator. For example – let us say we want to test a rotational strategy, where we rotate our portfolio every 2nd Monday. To detect such condition in our code we need to first identify all Monday bars, then count them and use % operator to divide such count by 2.

The following exploration shows the calculations of the condition we look for:

Filter 1;
AddColumnDayOfWeek(), "Day of week");
AddColumnMon"Monday");
AddColumncountMon"Monday counter");
AddColumncountMon == 0"division by 2 remainder");
AddColumnrotation"condition"1colorDefaultIIfrotationcolorYellowcolorDefault) )

Modulus 2

Here is the formula showing how to code these technique for the rotational back-test:

SetBacktestModebacktestRotational );
posScore 100 RSI(); // sample scoring indicator
SetPositionSize10spsShares ); // sample position sizing

Mon DayOfWeek() == 1// identify Mondays
countMon CumMon ); // count Mondays

// rotate only on Monday, every 2nd one
rotation Mon AND (countMon == );
PositionScore IIfrotationposScorescoreNoRotate )

Choosing compression method for Aux1 and Aux2 fields

Apart from regular Open, High, Low, Close, Volume, OpenInt fields – AmiBroker database allows to store custom data in auxiliary fields called Aux1 and Aux2. This allows to import our custom arrays and store in the database.

Since the data stored in those fields will vary, depending on the actual records imported in there – then in case of time-compressed intervals we may need to determine how exactly these values are compressed if we e.g. switch from Daily to Weekly interval. By default these values would get compressed the same way as Close field, i.e. Last value from given period would be used. We can however choose specific compression method if we need these fields to behave differently (for example like Volume, where weekly record represents a Sum of daily volumes).

The compression mode for Aux1 and Aux2 can be defined in File->Database Settings->Intraday Settings dialog Aux1,2 aggregation mode field:

Aux compression mode

How to fix side-by-side configuration error in 64-bit version

When 64-bit version of AmiBroker is installed, the setup program checks in the system registry if required runtime libraries are present, and if not – then it downloads and installs proper runtimes from Microsoft website. However – it may sometimes happen that the information in the system registry indicates that the required runtimes are installed, while in fact they are missing or incomplete. In such situations we may see the following error displayed when launching AmiBroker:

The application has failed to start because its side-by-side configuration is incorrect.
Please see the application event log for more detail.

To fix the problem we need to install Microsoft C++ runtime libraries vcredist_x64.exe manually. Correct x64 VC2005 runtime required by 64-bit version has the version number 8.0.50727.6195

It can be downloaded and installed from:
https://www.microsoft.com/en-us/download/details.aspx?id=26347

More documentation can be found at
https://support.microsoft.com/kb/2538242

NOTE: This article applies only to AmiBroker 64-bit from version 5.60 to 6.11. It does NOT apply to any 32-bit version of AmiBroker.

Deleting symbols with comma in the name

When importing symbols into the database, we may sometimes encounter situations, when as a result of user-mistake we import erroneous ticker names into our database. This may for example happen when we specify an incorrect column separator in ASCII importer (or use incorrect import definition that does not match the imported file) or when we use input file that contains commas when importing watchlist members using Symbol->Watchlist->Import.

As a result – we may end up with a ticker list like this:

Problematic symbols

In this case marking the symbols in Symbols window and using Delete option from the context menu will not work, because AmiBroker treats the comma as a separator between symbols.

To solve the problem – with relatively few tickers we can always just open Symbol->Information window and fix the names in there. However – with a larger group of symbols it will not be very practical.

In such case, in order to delete the incorrect symbols from the database – we can use Symbol->Organize Assignments window, mark the tickers in left-hand-side panel and press Delete to remove these symbols.

Removing problematic symbols

There is also a way to delete the symbols manually from the database folder by removing respective data-files. This requires the following steps:

  1. Exit AmiBroker
  2. go to respective subfolder of the database folder (in Windows Explorer)
  3. delete data-files for the particular symbols
  4. delete broker.master file from the database folder (it stores the symbol list)
  5. restart AmiBroker and load the database

Drawing line extensions on future bars using AFL

AmiBroker allows to display the AFL-based chart output on the future blank bars area with use of XSHIFT argument of the Plot function. This functionality allows to move the particular chart by certain number of bars and place the output within the blank bars area (provided that we use positive value for XSHIFT, i.e. we are shifting the chart to the right).

The following code shows price chart with 20-period MA overlay and additionally – with the same 20-period MA shifted to the right.

PlotClose"Close"colorDefaultstyleBar );

PlotMAClose20 ), "MA-20"colorRedstyledashed );
PlotMAClose20 ), "MA-shift"colorRedstyleThickNullNull10)

Chart with XShift

However – there may be some situations where we not only want to shift the chart position, but actually calculate the position of the line on the blank bars, for example if we are producing an extension of the existing indicator line.

Let us consider a simple example, which draws a line connecting the last record of the input array with the value 50-bars ago, using LineArray() function.

The code is the following:

inputArray Close;
PlotinputArray"input"colorDefaultstyleDots );

bi BarIndex();
lvbi LastValuebi );
x0 lvbi 50;
x1 lvbi;
y0 inputArraylvbi 50 ];
y1 inputArraylvbi ];

PlotLineArrayx0y0x1y1True True ), "line"colorRedstyleThick )

and the output looks like this:
Chart with XShift

LineArray function allows to calculate the extension automatically if we set EXTEND argument to True, however – all the calculations in AFL language are performed within the ‘real bars’ area, i.e. on the available elements of the array, between array item 0 until array item (Barcount-1).

To calculate and display the values that extend past the very last bar available in the array we will use technique explained below:

  1. first we shift the input back (to the left) by N bars, so the real input data would occupy earlier part of the array and we would have extra bars at the end for the calculation of extended arrays
  2. now we calculate the position of arrays on such shifted
  3. shift the displayed output forwards with XSHIFT functionality of Plot function (so the calculated extensions would get aligned onto the blank bars as a result).

If our original input array contains 200 bars and the line was drawn between bar 150 and the bar 200, then our aim is to shift the array that way, so the line would occupy the bars between bar 140 and bar 190, while the remaining 10 bars at the end of the array could be used for calculating the extended part of the line. Then – using XSHIFT we could place the array back into its original position.

inputArray Close;
PlotinputArray"input"colorDefaultstyleDots );

// here we shift the input array to the left
shift 10;
inputArray RefinputArrayshift );

// calculations of the x-y coordinates of the LineArray
// take into account the fact that array has been shifted
bi BarIndex();
lvbi LastValuebi );
x0 lvbi 50 shift;
x1 lvbi shift;
y0 inputArraylvbi 50 shift ];
y1 inputArraylvbi shift ];

// lineArray shifted back to original (correct) position with XSHIFT
PlotLineArrayx0y0x1y1TrueTrue ), "line"colorRedstyleThickNullNullshift );

//positions that were used for calclations before using xshift
PlotinputArray"input shifted"colorLightGreystyleDashed );
PlotLineArrayx0y0x1y1TrueTrue ), "line shifted"colorRedstyleDashed )

Chart with XShift

Dashed lines in the above chart show the shifted positions of the input array and calculated LineArray before using XSHIFT (i.e. on the bars that were used for actual calculations)

How to delete quotes without removing the symbol from a database

In order to delete quotations from a local database manually, we can use Quotations Editor (Symbol–>Quote Editor), then mark the required range of quotes and press Delete button. To mark a range – it is enough to click on the first line of the range, then scroll to the other line, hold SHIFT and click on the end-line of the range. To multi-select individual lines, hold down CTRL key while clicking on the lines.

Delete quotes

There is also a way to delete quotations programmatically with use of OLE automation interface explained here:

http://www.amibroker.com/guide/objects.html

The following code presents how to do it using automation scripts (the code deletes all quotations of MSFT ticker):

// THIS IS NOT AFL
// This is Windows script to be run from the outside of AmiBroker
function RemoveAllQuotes( Name )
{
    AB = new ActiveXObject("Broker.Application");
    Stk = AB.Stocks( Name );
    Quotes = Stk.Quotations;
    iQty = Quotes.Count;
    for( i = iQty - 1; i >= 0; i-- )
    {
       Quotes.Remove( i );
    }
    AB.RefreshAll();
}
RemoveAllQuotes("MSFT");
WScript.Echo ( "Completed" );

The code above is intended to be used from the outside of AmiBroker.

To use above code follow these steps:

  1. Open Notepad
  2. Copy-paste above the code
  3. Save the file with .JS extension (which means that system will treat this as JScript code)
  4. Make sure that AmiBroker is running with desired chart as active one
  5. Double click on .JS file to execute the JScript code

IMPORTANT: if you are running 64-bit Windows and have BOTH 32-bit and 64-bit versions of AmiBroker installed the OLE scripts by default would only talk to 64-bit instance. To use 32-bit version instead you would need to follow advice given in this article: “Running OLE automation scripts with 32- and 64-bit versions of AmiBroker”

Using the very same method you can delete quotes selectively, for example the script below deletes only quotes having zero volume:

// THIS IS NOT AFL
// This is Windows script to be run from the outside of AmiBroker
function RemoveQuotesWithZeroVolume( Name )
{
     AB = new ActiveXObject("Broker.Application");
     Stk = AB.Stocks( Name );
     Quotes = Stk.Quotations;
     iQty = Quotes.Count;
     cnt = 0;
     for( i = iQty - 1; i >= 0; i-- )
     {
        qt = Quotes.Item( i );
        if( qt.Volume == 0 ) 
        { 
           cnt++;
           Quotes.Remove( i );
        }
     }
    
     AB.RefreshAll();

     return cnt;
}
n = RemoveQuotesWithZeroVolume("MSFT");
WScript.Echo ( "Removed " + n + " quotes with zero volume" );

Running OLE automation scripts with 32- and 64-bit versions of AmiBroker

Automation scripts written in JScript or VBScript are supposed to be run from Windows Explorer to control AmiBroker from outside and run certain predefined tasks specified in the script. The recommended documentation explaining the automation interface and AmiBroker object model is presented here:
http://www.amibroker.com/guide/objects.html
http://www.amibroker.com/newsletter/01-2000.html

In case of any problems with execution of automation scripts, the very first thing to check is the .js (JScript) or .vbs (VBScript) file association within the Windows Control Panel. This determines which program in Windows executes the files with .js extension. By default that should be Windows Scripting Host, which is the default scripting engine integrated into Windows.

The following Microsoft help resources show how to change the file associations:
http://windows.microsoft.com/en-us/windows/change-default-programs#1TC=windows-7
http://windows.microsoft.com/en-us/windows-8/choose-programs-windows-uses-default

The other thing to remember is the fact that in 64-bit Windows there are actually two JavaScript engines, 32- and 64-bit. The location of those programs are:

32-bit
C:\Windows\SysWOW64\CScript.exe
64-bit
C:\Windows\System32\CScript.exe

If only one AmiBroker version installed, Windows would launch this installed version regardless of which scripting engine was used.

Things look differently if you installed both 32-bit and 64-bit versions of AmiBroker on the very same machine. In this case 32-bit scripting engine would open 32-bit AmiBroker while 64-bit scripting engine would open 64-bit AmiBroker.Therefore, if we want to specifically launch 32-bit AmiBroker, then pointing at the particular engine by using command line may be required:

C:\Windows\SysWOW64\CScript.exe Filename.js

(this one is for 32-bit version, the path names are in fact quite confusing, since Microsoft uses System32 folder for 64-bit programs in a 64-bit system).

Next Page »