amibroker

HomeKnowledge Base

Separate ranks for categories that can be used in backtesting

When we want to develop a trading system, which enters only N top-scored symbols from each of the sectors, industries or other sub-groups of symbols ranked separately, we should build appropriate ranks for each of such categories. This can be done with ranking functionalities provided by StaticVarGenerateRanks function.

The formula presented below iterates though the list of symbols included in the test, then calculates the scores used for ranking and writes them into static variables. The static variables names are based on category number (sectors in this example) and that allows to create separate ranks for each sector.

// watchlist should contain all symbols included in the test
wlnum GetOption"FilterIncludeWatchlist" );
List = 
CategoryGetSymbolscategoryWatchlistwlnum ) ;

if( 
Status"stocknum" ) == )
{
    
// cleanup variables created in previous runs (if any)
    
StaticVarRemove"rank*" );
    
StaticVarRemove"values*" );
    
categoryList ",";

    for( 
0; ( Symbol StrExtract( List, ) )  != "";  n++ )
    {
        
SetForeignsymbol );

        
// use sectors for ranking
        
category sectorID();

        
// add sector to the list
        
if( ! StrFindcategoryList"," category "," ) ) categoryList += NumToStrcategory1) + ",";

        
// write our ranking criteria to a variable
        // in this example we will use 10-bar rate-of-change
        
values RocClose10 );

        
RestorePriceArrays();

        
// write ranked values to a static variable
        
StaticVarSet"values" category "_" symbolvalues );

    }

    
// generate separate ranks for each category from the list
    
for( 1; ( category StrExtractcategoryList) ) != ""i++ )
    {
        
StaticVarGenerateRanks"rank""values" category "_"01224 );
    }
}

category sectorID();
symbol Name();
Month();

values StaticVarGet"values" category "_" symbol );
rank StaticVarGet"rank" "values" category "_" symbol );

// exploration code for verification
AddColumnvalues"values" );
AddColumnrank"rank" );
AddTextColumnSectorID), "Sector" );
AddColumnSectorID(), "Sector No");
Filter rank <= 2;

if( 
Status"Action" ) == actionExplore SetSortColumns25);

// sample backtesting rules
SetBacktestModebacktestRotational );
score IIfrank <= 2values);
// switch symbols at the beginning of the month only
PositionScore IIf!= Refm, -), scorescoreNoRotate );
SetPositionSize1spsPercentOfEquity )

Our test should be applied to a watchlist, which contains all symbols we want to include in our ranking code:
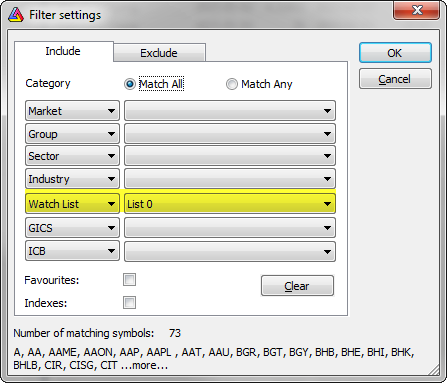
Watch list selection

Running the exploration will show two top-ranked symbols for each of the sectors:
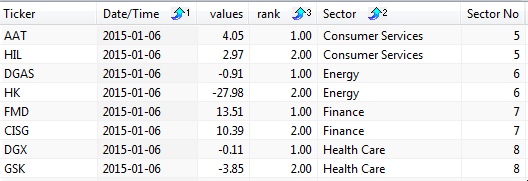
Ranking

We can also change Filter variable definition to

Filter 1

and show all ranked symbols instead.

Such ranking information can be used in backtest and sample rules included at the end of the code use rank information to allow only two top-scored symbols to be traded.

Ruin stop or mysterious Short(6) in the trade list

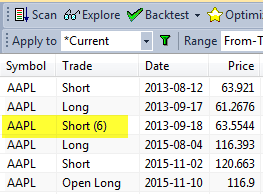
When you back-test a trading system, you may sometimes encounter trades marked with (6) exit reason, showing e.g.: Short (6) or Short (ruin) in the trade list as in the picture below:

Ruin stop in trade list

As explained in the this Knowledge Base article: http://www.amibroker.com/kb/2014/09/24/how-to-identify-which-signal-triggers/ such identifier tells us that the trade was closed because of the ruin stop activation.

A ruin-stop is a built-in, fixed percentage stop set at -99.96%, so it gets activated if your position is losing almost all (99.96%) of its entry value. It almost never occurs in long trades, but it may be quite common if your trading system places short trades without any kind of maximum loss stop. Imagine that you short a stock when its price is $10, then it’s price rises to $20 (twice the entry price). When you buy to cover the position you must pay $20 per share, which means that your loss on this trade is $10 per share ($20-$10). This means 100% loss (as per entry value). If you placed such a trade with all your capital you would be bankrupt. That is why this stop is called “ruin stop”. Unfortunately, by the nature of short selling, the gains are limited to 100% (when stock price goes down to zero) but losses are virtually unlimited.

So what to do to prevent exits by ruin stop?

The best idea is to just place proper max. loss stop at much smaller percentage (such as 10% or 20%) depending on what your risk tolerance is, to limit drawdowns and decrease the chance of wiping your account down to zero.

If, for some weird reason, you want to turn OFF this built-in stop, you can do so using this code:

SetOption"DisableRuinStop"True )

but it is highly discouraged, because when you wipe your account down to zero (or even below zero) it makes no point to run back-test any further. Instead of disabling this feature you should place proper, tighter maximum loss stop.

How does risk-mode trailing stop work?

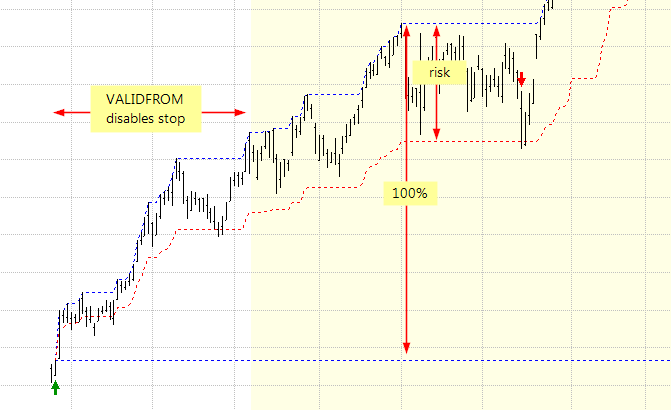
In addition to regular percent or point based stops, AmiBroker allows to define stop size as risk (stopModeRisk), which means that we allow only to give up certain percent of profit gained in given trade. The picture presented below visualizes a risk-mode trailing stop using 35% risk size. Since at the very beginning of the trade profits may be very low (and potentially triggering unwanted exits), this type of stop is best to use with validFrom argument, which allows to delay stop activation by certain number of bars.

The blue line on top represents highest high since entry, while red line shows the stop level calculation, yellow area shows the bars, where our stop has become active:

Risk-mode trailing stop

The above levels were calculated with the following code:

Buy DateNum() == 1140425// custom entry on a fixed date
Sell 0;
BuyPrice SellPrice close;

riskSize 35;
daysDelay 50;

ApplyStopstopTypeTrailingstopModeRiskriskSize1False0daysDelay );
Equity);

priceAtBuy ValueWhenBuyBuyPrice );
highsinceBuy HighestSinceBuyHigh);
stoplevel priceAtBuy + ( highsinceBuy priceAtBuy) * (100-riskSize)/100;

PlotClose"Close"colorDefaultstyleBar );
Plotstoplevel"stop"colorRedstyleDashed );
PlothighsinceBuy"highsinceBuy"colorBluestyleDashed );
PlotpriceAtBuy"priceAtBuy"colorBluestyleDashed );
PlotBarsSinceBuy ) > daysDelay""ColorBlendcolorYellowcolorWhite,0.9), styleArea|styleOwnScale,0,1,0,-1);

PlotShapes(Buy*shapeUpArrowcolorGreen0Low);
PlotShapesIIfSellshapeDownArrowshapeNone), colorRed0High)

Symbol selection when PositionScore is not defined

AmiBroker’s portfolio backtester allows to define stock ranking and selection criteria by means of PositionScore variable. This is explained in details in the following tutorial chapter:

http://www.amibroker.com/guide/h_portfolio.html

If PositionScore is not defined or it has the same value for two or more symbols, then AmiBroker will use the following rules:

  1. transaction with greater PositionSize is preferred – the comparison method depends on the position sizing approach used in our code:
    • If we use SetPositionSize( dollarvalue, spsValue) – then $ value is compared.
    • If we use SetPositionSize( shares, spsShares) – then number of shares is used for comparison.
    • If we use SetPositionSize( perc, spsPercentOfEquity) – then % equity matters.
  2. alphabetical order
  3. long trades rather than short trades, if both occur at the same time for the same symbol.

How to handle delisted symbols in rotational test

This Knowledge Base article: http://www.amibroker.com/kb/2014/09/26/closing-trades-in-delisted-symbols/ explains how to close trades in delisted symbols in regular backtest (to avoid holding delisted stocks in the trade list and have our max symbol limit impacted by those positions).

In rotational test however we cannot use Sell variable, because trades are driven by symbols’ ranking by PositionScore values. Therefore we would need to assign zero to PositionScore variable for the exit bars respectively – this will force exiting any positions held in given stock.

EnableRotationalTrading();

bi BarIndex();
lastbi LastValuebi ) - Status("BuyDelay");
exitLastBar bi == lastbi;

score /*our regular positionScore*/;
PositionScore IIfexitLastBar 0score )

Note that we are adjusting the last bar index in case trade delays are set in the settings.

As in the regular test, we can also use DelistingDate information if we have it imported into Symbol ->Information window.

EnableRotationalTrading();
exitLastBar datetime() >= GetFnData("DelistingDate");

score /*our regular positionScore*/;
PositionScore IIfexitLastBar 0score )

How to display interest gains in the backtest report

The default backtest report shows total Net Profit figure, which includes both trading profits and interest earnings. With Custom Backtest procedure we can easily isolate these components by summing up profits and loses from individual trades, then subtracting trading gains from the Net Profit and report them as separate metrics.

SetCustomBacktestProc"" );

if ( 
Status"action" ) == actionPortfolio )
{
    
bo GetBacktesterObject();
    
bo.Backtest(); // run default backtest procedure

    // read Net Profit, Winners and Losers profits from the report
    
st bo.GetPerformanceStats);
    
netProfit st.GetValue"NetProfit" );
    
tradeProfits st.GetValue("WinnersTotalProfit") + st.GetValue("LosersTotalLoss");

    
bo.AddCustomMetric"Trading profits"tradeProfits );
    
bo.AddCustomMetric"Interest earnings"netProfit tradeProfits );

}

// trading rules here
Buy CrossMACD(), Signal() );
Sell CrossSignal(), MACD() )

After backtest is run, we can see our custom metrics in the backtest report.

More information about creating custom metrics can be found in the manual:
http://www.amibroker.com/guide/a_custommetrics.html

Using optimum parameter values in backtesting

After Optimization process has found optimum values for parameters of our trading system, typically we want to use optimum values in subsequent backtesting or explorations. In order to achieve that, we need to manually update default_val (second) argument of Optimize function with the values obtained from the optimization report.

The arguments of Optimize function are shown below (note second parameter marked in dark red color – this is the default value parameter we will be changing after optimization run):

some_var = Optimize( "description", default_val, min_val , max_val, step );

Let us consider the following example formula used for optimization process:

SetOption("ExtraColumnsLocation"1);
periods Optimize"Periods"2550); // note that default value is 2
Level Optimize"Level"22150); // note that default value is 2

Buy CrossCCIperiods ), -Level );
Sell CrossLevelCCIperiods ) )

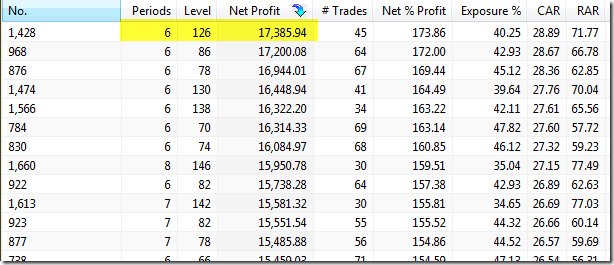
If we perform Optimization process and check the results (for this example we use Net Profit as the optimization target), we can see that the best results use Periods = 6 and Level = 126.

Optimization result

Now in order to run backtest and obtain exactly the same results as in the respective line of the above Optimization results, we need to enter the values into default argument, so the modified code will look like this:

SetOption("ExtraColumnsLocation"1);
periods Optimize"Periods"6550); // we changed default value to 6
Level Optimize"Level"1262150); // we changed default value to 126

Buy CrossCCIperiods ), -Level );
Sell CrossLevelCCIperiods ) )

Now we can use the code with modes other than Optimization and the formula will use optimized values we retrieved from the results.

Using multiple watchlists as a filter in the Analysis

The Filter window in the Analysis screen allows us to define a filter for symbols according to category assignments, for example watchlist members (or a result of mutliple criteria search).

The filter allows us to select one watch list for “inclusion” and one for “exclusion”. To include members of more than one watchlist, we can not simply pick them both in the Filter window – we need to combine these symbols together in another dedicated watchlist storing symbols from both lists.

Let us say we want to run a test on members of List 1 and List 2. To combine these watchlists together we need to follow the instructions below.

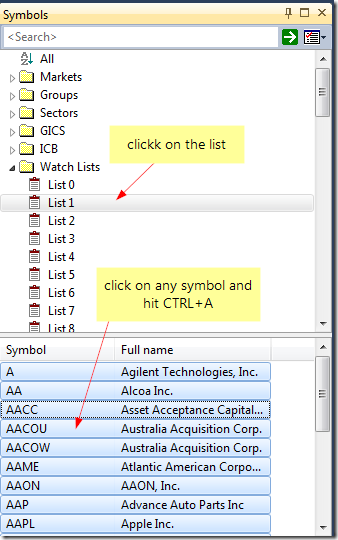
  1. Click on List 1, then in the bottom part of the Symbols window mark all tickers. A multiple selection is done by clicking on first and last item in the list while holding down the Shift key. We may also select all symbols by clicking on any symbol and pressing Ctrl+A key.

    Select symbols from watch list

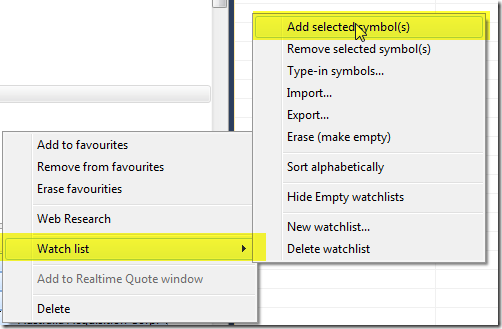
  2. Now click on the selection with right mouse button and choose Watch list->Add selected symbol(s)

    Add symbols to watch list

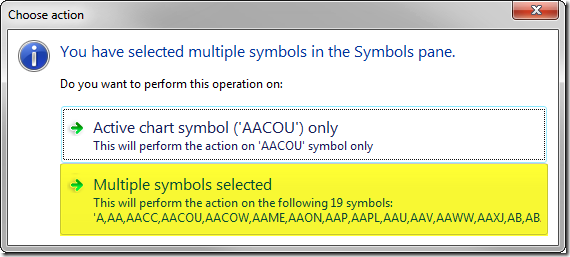
  3. Pick an empty watchlist that we will use to combine our tickers (e.g. List 5 ) and confirm to add multiple symbols:

    Confirm adding multiple symbols

  4. Repeat the above steps 1-3 with List 2 members
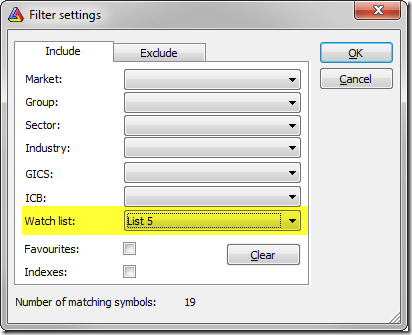
  5. Now we can pick List 5 in the Filter window and run the test on all the tickers

    Create new watch list

An alternative solution to this is to filter out unwanted symbols in the code. In this case AmiBroker would need to run analysis for all tickers (so Apply to would need to be set to All symbols) and apply filtering while executing your formula. To do so you may use code like this for backtesting (filtering Buy signals):

Buy /* your regular trading rules here */;

watchlistCheck InWatchList) OR InWatchList);
Buy watchlistCheck  AND Buy// combine watch list filter with your rule

or code like this in exploration (adding extra condition to Filter variable):

Filter /* your regular exploration filter here */;
watchlistCheck InWatchList) OR InWatchList);
Filter watchlistCheck AND Filter// combine watch list filter with your rule

Please keep in mind that filtering in the code is significantly slower. Using this method AmiBroker needs to read the data for all tickers, prepare arrays, then evaluate the formula and verify the condition – so using Filter window and the first approach will be faster, as the filtering is done before the formula execution, saving lots of time required for data retrieval and AFL execution.

How to copy backtest trade list to a spreadsheet

There are several ways to transfer the backtest results to a spreadsheet.

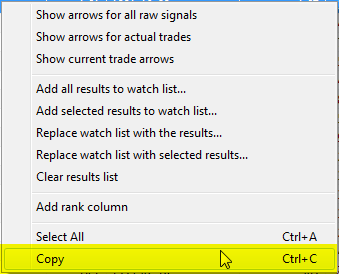
  1. Immediately after the test we can just click on the results list with right mouse button and choose Copy from the menu. It is also possible to click on the results and use Ctrl+C key shortcut.

    Copy Trade List

    The operation will copy the entire list, so there is no need to select all rows manually.

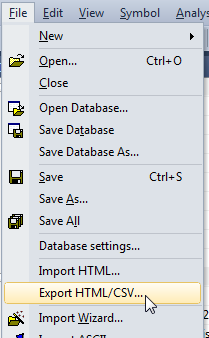
  2. After the test, we can also use File->Export option from the main program menu to export the results list to a CSV or HTML file, which could be opened from Excel later on.

    Export Trade List

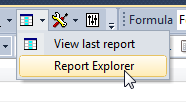
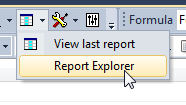
  3. Backtest results are also accessible through the Report Explorer:

    Backtest Report Explorer

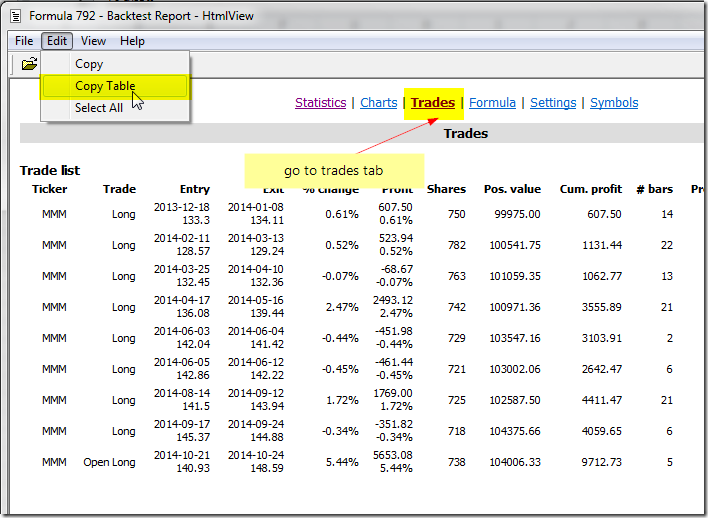
    In order to open detailed report for the particular test it is enough to double-click on the selected line. Then, after we navigate to Trade List page, to copy the results, the best option to use is Edit->Copy Table

    Copy Table

    Unlike the regular Copy option, Copy Table transforms HTML tables into CSV format and copies it into clipboard so tables can be pasted easily to Excel. Also it divides Entry/Exit columns into separate Entry/exit date/price columns.

How to backtest symbols individually

By default, when we run backtest over a group or watchlist of symbols – AmiBroker will perform a portfolio test. However, there is also an Individual mode of the backtest available, where every symbol is tested individually and independently.

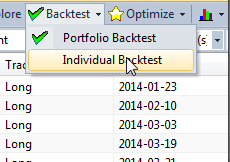
Once we send the formula to Analysis window and define group of symbols to run code on (Apply To), in order to run an individual backtest, it is necessary to unfold the menu next to Backtest button and choose Individual Backtest from the menu.

Individual Backtest

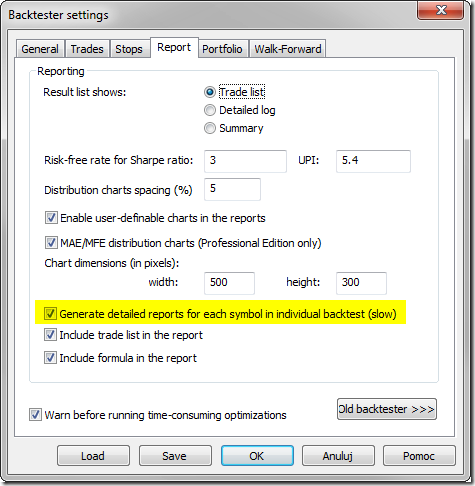
To get full report generated for each of the tests, it is required to first go to Analysis–>Settings->Report tab and mark Generate detailed reports for each symbol in individual backtests option.

Individual Backtest Report

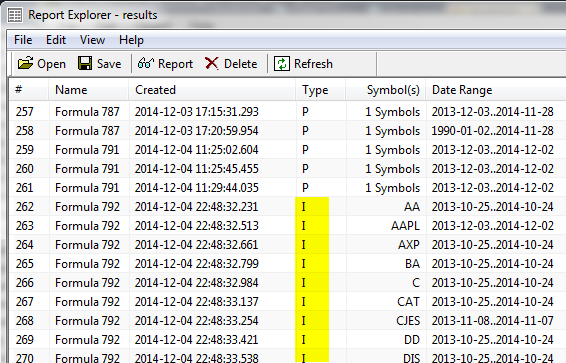
Then the full reports can be accessed through the Report Explorer.

Report Explorer

The letter I indicates that the report contains results of an individual test. Double-clicking on the particular results line will show full contents of the backtest report.

Report Explorer List

Next Page »