amibroker

HomeKnowledge Base

How to restore program menus and/or toolbars

If we unintentionally make some changes to our toolbars or main menu using customization option, there is an easy way to restore the toolbars and menus to the default settings.

All we have to do is to select Tools->Customize menu, then in the Toolbars tab of the Customize dialog, click on the item we want to restore and press Reset button.

Reset toolbar

If any toolbar is missing, please verify if it has a checkmark switched on in the list shown above.

If all of this does not help and the toolbar and/or menu are still missing, then we can reset the position of all toolbars by using REGEDIT tool and removing all entries responsible for toolbar positions. The procedure is the following:

  1. exit AmiBroker
  2. use REGEDIT tool to edit the system registry (Windows Start->Run / type in: regedit )
  3. delete all entries starting with:
    HKEY_CURRENT_USER\Software\TJP\Broker\CommandBars
    

    as presented in the picture below

Reset toolbar

How to move a window to another monitor

By default document windows like Charts, Analysis, Account Manager, Web Research all open inside of main AmiBroker frame window. In multi-monitor setups it may be useful however to move some of them to another screen.

Let us say we want to move Analysis window to second monitor screen. This can be done by switching the window to special “Floating” mode by using Window->Floating option from the menu after opening Analysis.

Window menu

Using floating mode detaches Analysis from the main frame and then the window can be moved outside of it.

Window menu

Exactly the same procedure works for Chart windows, Account Manager or Web Research windows.

The procedure (for chart window) has also been shown in this video:
http://www.amibroker.com/video/FloatAndLink.html

Deleting symbols with comma in the name

When importing symbols into the database, we may sometimes encounter situations, when as a result of user-mistake we import erroneous ticker names into our database. This may for example happen when we specify an incorrect column separator in ASCII importer (or use incorrect import definition that does not match the imported file) or when we use input file that contains commas when importing watchlist members using Symbol->Watchlist->Import.

As a result – we may end up with a ticker list like this:

Problematic symbols

In this case marking the symbols in Symbols window and using Delete option from the context menu will not work, because AmiBroker treats the comma as a separator between symbols.

To solve the problem – with relatively few tickers we can always just open Symbol->Information window and fix the names in there. However – with a larger group of symbols it will not be very practical.

In such case, in order to delete the incorrect symbols from the database – we can use Symbol->Organize Assignments window, mark the tickers in left-hand-side panel and press Delete to remove these symbols.

Removing problematic symbols

There is also a way to delete the symbols manually from the database folder by removing respective data-files. This requires the following steps:

  1. Exit AmiBroker
  2. go to respective subfolder of the database folder (in Windows Explorer)
  3. delete data-files for the particular symbols
  4. delete broker.master file from the database folder (it stores the symbol list)
  5. restart AmiBroker and load the database

Timestamps explained

When AmiBroker is fed with the data, say 1-minute data, it can create all other time intervals by compressing source data on-the-fly. So if you display say 13-minute chart, AmiBroker takes source 1-minute data and builds 13-minute blocks of data to create 13-minute bars. For this process to work correctly, source data need to have timestamps that point to the START of each bar interval. So with 1-minute data, the bar that has a timestamp 9:30:00 is supposed to cover trades from the period of 9:30:00.000 upto 9:30:59.999. All our data plugins provide data in that format.

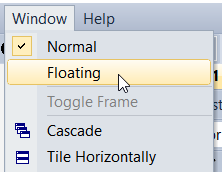
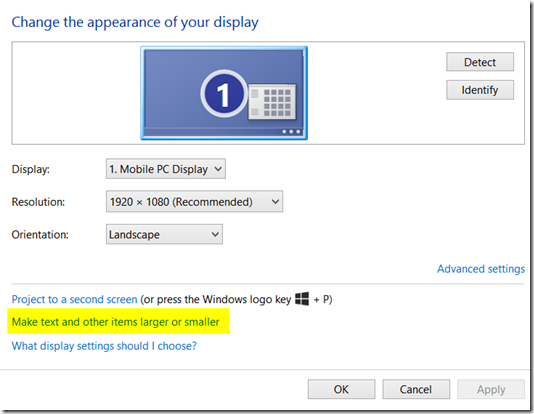
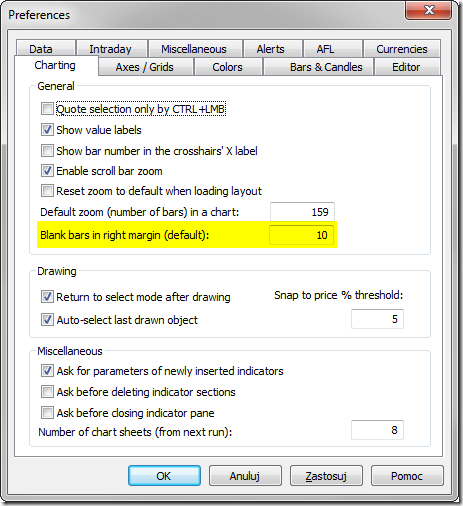
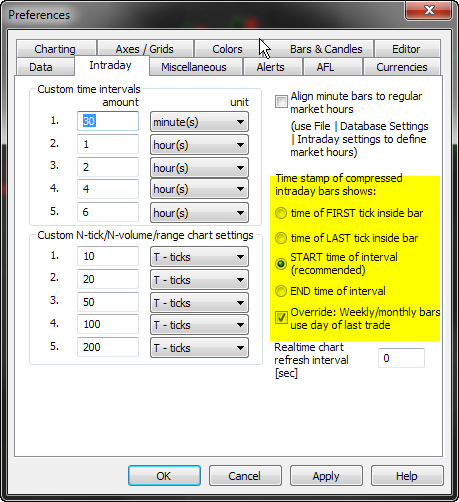
Now, provided that we have say 1-minute data, AmiBroker can compress data to any other N-minute interval. When doing so, it can assign timestamps to compressed bars in different ways. This can be controlled through Tools->Preferences->Intraday dialog.

Timestamps

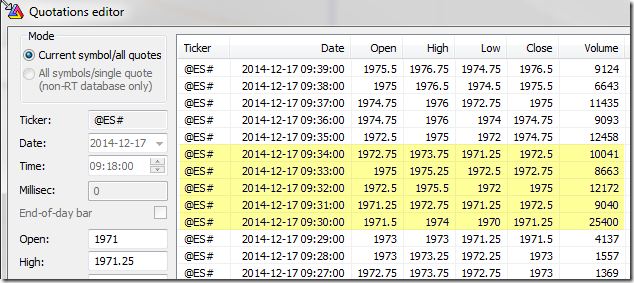
Let us check it on an example of a 5-minute bar based on input 1-minute quotes for e-mini contract.

Timestamps

As explained in the manual (http://www.amibroker.com/guide/w_preferences.html) – there are four choices available:

  1. Time of FIRST tick inside bar – when selected the bar gets the time stamp of the very first trade inside given time slot (bar). With this choice the bar will be stamped with 9:30:00 because this is the first tick (quote) available within that 5-min period
  2. Time of the LAST tick inside bar – when selected the bar gets the time stamp of the very last trade inside given time slot (bar). In this case the bar will be stamped with 9:34:00 because this is the last quote available within that 5-min period
  3. START time of the interval – when selected the bar is time-stamped with start time of the time slot (bar). The bar will be stamped with 9:30:00 because that is a beginning of the selected time period.
    NOTE: This is recommended and the default setting as it provides consistency with how source bars are timestamped. It should not be changed unless you have really good reason to do so.

  4. END time of the interval – when selected the bar is time-stamped with start time of the time slot (bar). The bar will be stamped with 9:34:59 timestamp, because that’s the very end of this 5-min period.

There is also an additional setting available (Override: Weekly/monthly bars use day of last trade), which allow to modify the behaviour in case of Weekly/Monhtly bars, no matter what is the main setting we use. This allows us to e.g. use START time of interval to identify intraday quotes, however – on a weekly chart display e.g. Wednesday date (if that is most recent day in current week) or Friday date for complete weeks.

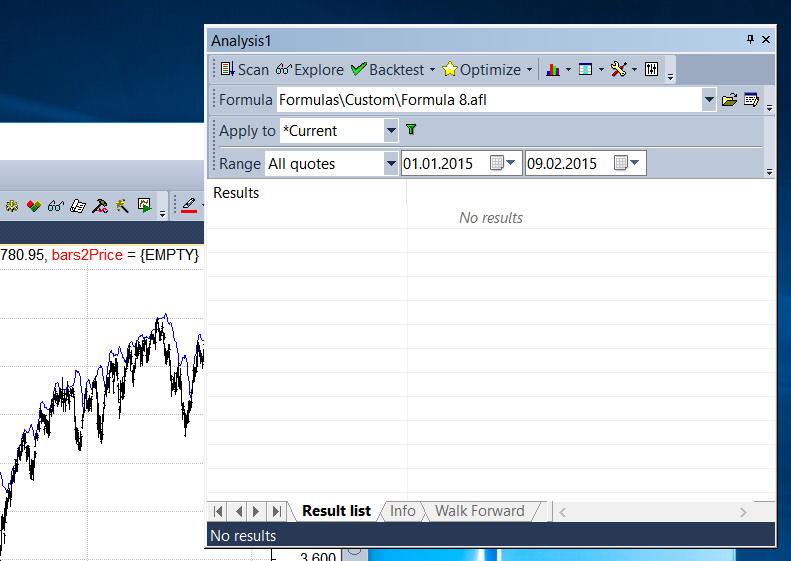
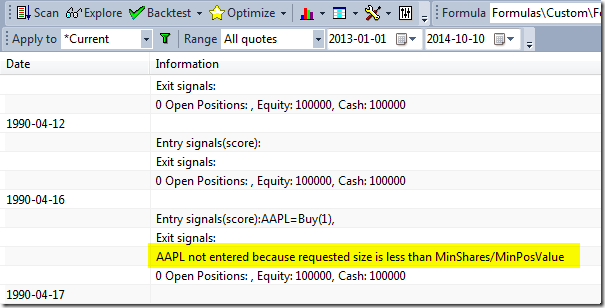
We need to remember that the timestamps identify the whole bar and all trades within that bar, so if we use START time of interval for time-stamping, in the backtest use Close array for as BuyPrice and 5-minute periodicity, then in our report we will see:

Timestamps

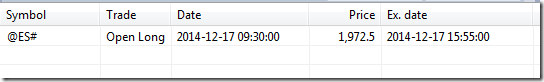
So, we see the time 9:30:00, but this bar refers to trading activity from period 9:30:00-9:34:59 and the actual price is read from the tick being the Close of the whole 5-minute period (at 9:34:00 in the table above).

For the same reason – when we use weekly data for backtesting, we trade at Open, but for time-stamps we use Override box (so weekly bars are stamped with the data of the last day within given week) – then in the report we will see e.g. Friday dates because of the fact that we use such approach to time-stamp bars. This does not really mean that trade happened on Friday, but only that we use Friday date to identify the whole Monday-to-Friday week.

How to increase font size for UI elements

In order to change / increase font size used for AmiBroker user interface elements, we can choose one of the following solutions:

  1. Set higher DPI in Windows Control Panel, or
  2. Set font size for individual UI elements such as list views using Windows Control Panel,

To set higher DPI in Windows Control Panel, follow the instructions below.

If you are using Windows 7 or Windows 8:

Open Screen Resolution by clicking the Start button, clicking Control Panel, and then under Appearance and Personalization, click Adjust screen resolution. Then click Make text and other elements larger or smaller

Control Panel

Now set the size of fonts choosing Medium or Larger in order to increase fonts globally.

Control Panel

For Windows XP – please follow the Microsoft documentation presented here:
https://www.microsoft.com/resources/documentation/windows/xp/all/proddocs/en-us/display_use_large_or_small_fonts.mspx?mfr=true

It is also possible to avoid changing all fonts globally and enlarge fonts e.g. for list views only. This can be done by adjusting the default icon system font in Control Panel.

If you are using Windows 8:

the Icon font can be changed in the same dialog as DPI settings discussed previously:

Control Panel

If you are using Windows 7:

In order to access the respective dialog – click on the desktop area with right-mouse button, click Personalize in the context menu, click on Window Color, then click on Advanced appearance settings option at the bottom.

Alternatively, navigate to Control Panel and in the search field in the top-right corner enter ‘window color’ – then pick Change window colors and metrics from the search results.

Then adjust Icon font in the Window Color and Appearance window as shown below:

Window Color and Appearance

For Windows XP – the procedure to get to the dialog is explained here:
http://windows.microsoft.com/en-us/windows-xp/help/setup/personalize-windows-xp

Finally, if we just want to change fonts used by the charts, i.e. X/Y axis, Title and text tool font – it is definable directly in Tools->Preferences->Miscellaneous, Axis font field.

If we want to change AFL Formula Editor font, it can be set in Tools–>Preferences–>Editor page.

Using multiple watchlists as a filter in the Analysis

The Filter window in the Analysis screen allows us to define a filter for symbols according to category assignments, for example watchlist members (or a result of mutliple criteria search).

The filter allows us to select one watch list for “inclusion” and one for “exclusion”. To include members of more than one watchlist, we can not simply pick them both in the Filter window – we need to combine these symbols together in another dedicated watchlist storing symbols from both lists.

Let us say we want to run a test on members of List 1 and List 2. To combine these watchlists together we need to follow the instructions below.

  1. Click on List 1, then in the bottom part of the Symbols window mark all tickers. A multiple selection is done by clicking on first and last item in the list while holding down the Shift key. We may also select all symbols by clicking on any symbol and pressing Ctrl+A key.

    Select symbols from watch list

  2. Now click on the selection with right mouse button and choose Watch list->Add selected symbol(s)

    Add symbols to watch list

  3. Pick an empty watchlist that we will use to combine our tickers (e.g. List 5 ) and confirm to add multiple symbols:

    Confirm adding multiple symbols

  4. Repeat the above steps 1-3 with List 2 members
  5. Now we can pick List 5 in the Filter window and run the test on all the tickers

    Create new watch list

An alternative solution to this is to filter out unwanted symbols in the code. In this case AmiBroker would need to run analysis for all tickers (so Apply to would need to be set to All symbols) and apply filtering while executing your formula. To do so you may use code like this for backtesting (filtering Buy signals):

Buy /* your regular trading rules here */;

watchlistCheck InWatchList) OR InWatchList);
Buy watchlistCheck  AND Buy// combine watch list filter with your rule

or code like this in exploration (adding extra condition to Filter variable):

Filter /* your regular exploration filter here */;
watchlistCheck InWatchList) OR InWatchList);
Filter watchlistCheck AND Filter// combine watch list filter with your rule

Please keep in mind that filtering in the code is significantly slower. Using this method AmiBroker needs to read the data for all tickers, prepare arrays, then evaluate the formula and verify the condition – so using Filter window and the first approach will be faster, as the filtering is done before the formula execution, saving lots of time required for data retrieval and AFL execution.

How to measure price / percentage distance on the chart

The easiest way to manually measure distance between two points on the chart is to use a regular trend-line drawing tool for this purpose.

First we need to draw the line between the selected points (Insert->Trendline). It may be useful to have Insert->Snap to Price option marked if we want our line to start and end exactly at OHLC levels of respective price bar.

Once trend line is drawn, we need to hover the mouse cursor over the line and the tooltip will show both price and percentage change between the Start and End points:

Measure distance

How to configure alerts to work with SSL e-mail accounts

In order to send e-mail alerts to accounts requiring SSL (secure socket layer) connection you need to follow these steps:

  1. Download and run SSL add-on from: http://www.amibroker.com/bin/SSLAddOn.exe.
    Extra steps for 64-bit installs only: By default EMailerSSL.exe program is installed into AmiBroker 32-bit installation folder – but it is also possible to use it with 64-bit version of AmiBroker with some additional steps:

    1. Create C:\Program Files (x86)\AmiBroker folder (if 32-bit version of AB is not installed)
    2. Run SSLAddOn.exe from the link above
    3. Copy EMailerSSL.exe from C:\Program Files (x86)\AmiBroker folder to C:\Program Files\AmiBroker folder

  2. Configure account in the Tools->Preferences->Alerts, for example GMail configuration looks as follows:

    Email alert configuration for GMail

  3. In certain cases the e-mails may be blocked by default Gmail account settings. If the authentication fails with an error message, it may be required to visit: https://www.google.com/settings/security/lesssecureapps and switch Access for less secure apps to Enable as shown below:

    Email alert configuration for GMail

Troubleshooting procedure when backtest shows no trades

When we run backtest and get no results at all – there may be several reasons of such behaviour. The main potential causes are the following:

  1. our system does not generate any entry signals within the tested range
  2. our settings do not allow the backtester to take any trades

To verify if we are getting any signals – the first thing to do is to run a Scan. This allows us to check if we are getting any Buy or Short signals at all. If there are none, then we need to check the formula and make sure that data interval we are working on are correct (in Periodicity in Analysis->Settings->General).

If Scan works fine and returns trading signals, but backtester still does not produce any output, it usually means that the settings are wrong, i.e. the constraints set in the settings prevent trades from being opened mainly because requested position size is too big or too small.

To check what is going on, it is best to switch Report mode to Detailed log and re-run backtest.

Report - Detailed log

Once you run backtest in Detailed Log mode you will be able to find out exact reasons why trades can not be opened for each and every bar:

Detailed log output

Using the following settings may be helpful to minimize chances of not entering trades because of various constraints:

In Analysis->Settings, General tab:

  1. check if Initial Equity is high enough
  2. set Periodicity to the appropriate interval
  3. Allow position size shrinking – turn it On
  4. Round Lot Size – set it to 0
  5. in Min. Shares box enter 0.01
  6. in Min. pos. value enter 0
  7. Account Margin – set it to 100

Settings - General

in Portfolio tab, enter 0 in Limit trade size as % of entry bar volume box.

Settings - Portfolio

How to adjust the number of blank bars in right margin

The default number of bars shown in the right-hand side of the chart area is defined in Tools->Preferences->Charting:

Blank bars

It is also possible to extend the blank bars area manually. Pressing END key on the keyboard will add 10 extra bars with each keystroke. Pressing HOME will reset the blank bars area back to default value from Preferences.

Number of bank bars can also be controlled using SetChartOptions() function from the code.

SetChartOptions00chartGridMiddle00100 );
PlotClose"Close"colorDefaultstyleBar )

Detailed documentation of SetChartOptions function is available in the manual:
http://www.amibroker.com/f?SetChartOptions

Next Page »