amibroker

HomeKnowledge Base

How to increase maximum periods of built-in indicators

Built-in indicators and averages which are shipped with AmiBroker use Param() function calls to provide the ability to adjust parameter values through Parameters window. Param function in the code specifies default, minimum, maximum values for the input arguments.

The order of arguments in Param function is the following:

Param"name"defaultvalminmaxstepsincr 

In certain situations, we may however want to use larger period settings than the pre-defined maximum. There is an easy way to adjust the code to achieve such task. Let us consider using built-in Price (all in one) indicator and setting e.g. 200 or 300 periods for Bollinger Bands (default maximum is 100).

To modify the underlying code, we need to:

  1. Click on the chart with right mouse button and choose Edit Formula from the context menu to bring up the AFL code editor
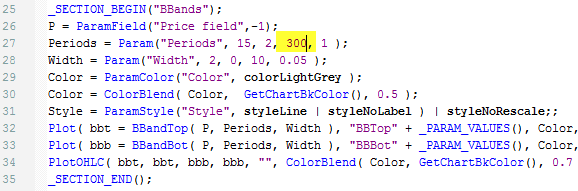
  2. In the code identify Bollinger Band section and the Param function call responsible for setting number of periods and change it from 200 to 300 as shown in the picture below.

    Param call

  3. Approve the changes, by selecting Tools->Apply from the editor’s menu

Now we can go back to Parameters dialog and we will be able to set Bollinger Bands Periods setting up to 300 periods.

How to run certain piece of code only once

There are situations where we may need to run certain code components just once, e.g. to initialize some static variables before auto-trading execution or perform some tasks (such as ranking) at the very beginning of backtest or exploration. The following techniques may be useful in such cases:

When we want to execute certain part of code just once after starting AmiBroker, we may use a flag written to a static variable that would indicate if our initialization has been triggered or not.

if( NzStaticVarGet("InitializationDone") ) == )
{
   
StaticVarSet("InitializationDone"1);
   
// code for first execution

If we want to run certain part of code at the beginning of the test run in Analysis window, we can use:

if ( Status("stocknum") == )
{
   
// our code here

When Status(“stocknum”) is detected in the code, then execution is performed in a single thread for the very first symbol. Only after processing of this first symbol has finished the other threads will start.

A practical example showing use of this feature is presented in the following tutorial:

http://www.amibroker.com/guide/h_ranking.html

How to browse charts in selected date range

In order to select certain range of dates in the historical chart, then scroll through the history of tickers, we can mark the range of dates we interested in using Range Markers (double-click on the chart or mark the bars and hit F12, SHIFT+F12).

Range markers

Then, use View->Zoom->Range menu to zoom the chart to our range selection.

Zoom to range

We can also assign a keyboard shortcut to View->Zoom->Range command or create a custom toolbar button to have it easily accessible (e.g. CTRL+SHIFT+R). This can be done in Tools->Customize (http://www.amibroker.com/guide/h_customizeui.html)

After we switch the symbol, in situations when the chart shifts e.g. due to different history length in those symbols – all we have to do is to hit CTRL+SHIFT+R to bring back the view to the range we wanted.

Browsing through the list of symbols can be automated further with scripts. Below is a sample auto-play script that will automatically browse through the list of symbols and will set the zoom to the dates we set in the code. All we need is just to start the script and watch it all switching automatically, without any manual actions required.

Here is a sample script that will browse through the list of symbols and set the zoom to show year 2010:

iWatchList 0/* you can define watch list number here */

AB = new ActiveXObject"Broker.Application" );
Qty AB.Stocks.Count;

for ( 
0Qtyi++ )
{
    
Stk AB.Stocks);

    if ( 
iWatchList 32 )
    {
        if ( 
Stk.WatchListBits & ( << iWatchList ) )
        {
            
AB.ActiveDocument.Name Stk.Ticker;
            
AW AB.ActiveWindow;
            
AW.ZoomToRange"2010-01-01""2011-01-01" );
            
WScript.Sleep2000 ); // 2 seconds delay
        
}
    }
    else
    {
        if ( 
Stk.WatchListBits2 & ( << ( iWatchList 32 ) ) )
        {
            
AB.ActiveDocument.Name Stk.Ticker;
            
AW AB.ActiveWindow;
            
AW.ZoomToRange"2010-01-01""2011-01-01" );
            
WScript.Sleep2000 ); // 2 seconds delay
        
}
    }

To use above code follow these steps:

  1. Open Notepad
  2. Copy-paste above the code
  3. Save the file with .JS extension (which means that system will treat this as JScript code)
  4. Make sure that AmiBroker is running with desired chart as active one
  5. Double click on .JS file to execute the JScript code

IMPORTANT: if you are running 64-bit Windows and have BOTH 32-bit and 64-bit versions of AmiBroker installed the OLE scripts by default would only talk to 64-bit instance. To use 32-bit version instead you would need to follow advice given in this article: http://www.amibroker.com/kb/2015/01/12/ole-automation-scripts-with-32-and-64-bit/

It is worth noting that going through series of charts is not the only way to compare performance of various symbols over time. There are other dedicated built tools for comparing several securities (without switching symbols, but within one chart window), including Price (Foreign) and Relative Performance indicator. These functionalities are shown in the following video:
http://www.amibroker.com/video/TwoSymbolsOneChart.html

How to restore program menus and/or toolbars

If we unintentionally make some changes to our toolbars or main menu using customization option, there is an easy way to restore the toolbars and menus to the default settings.

All we have to do is to select Tools->Customize menu, then in the Toolbars tab of the Customize dialog, click on the item we want to restore and press Reset button.

Reset toolbar

If any toolbar is missing, please verify if it has a checkmark switched on in the list shown above.

If all of this does not help and the toolbar and/or menu are still missing, then we can reset the position of all toolbars by using REGEDIT tool and removing all entries responsible for toolbar positions. The procedure is the following:

  1. exit AmiBroker
  2. use REGEDIT tool to edit the system registry (Windows Start->Run / type in: regedit )
  3. delete all entries starting with:
    HKEY_CURRENT_USER\Software\TJP\Broker\CommandBars
    

    as presented in the picture below

Reset toolbar

How to move a window to another monitor

By default document windows like Charts, Analysis, Account Manager, Web Research all open inside of main AmiBroker frame window. In multi-monitor setups it may be useful however to move some of them to another screen.

Let us say we want to move Analysis window to second monitor screen. This can be done by switching the window to special “Floating” mode by using Window->Floating option from the menu after opening Analysis.

Window menu

Using floating mode detaches Analysis from the main frame and then the window can be moved outside of it.

Window menu

Exactly the same procedure works for Chart windows, Account Manager or Web Research windows.

The procedure (for chart window) has also been shown in this video:
http://www.amibroker.com/video/FloatAndLink.html

How to categorize symbols coming from Metastock databases

Many data vendors that deliver data in MetaStock database format offer quotes in separate MS databases organized in several folders, separate for different markets or industries.

AmiBroker does not have any symbol limits, there is no need to maintain separate databases in AB and all the quotes can be placed in a single database. The configuration process of Metastock database as external data source is described here: http://www.amibroker.com/guide/h_extsources.html

AmiBroker supports internally many ways to categorise symbols into groups, markets, sectors, industries, etc. To learn more about categories available in AmiBroker please check this: http://www.amibroker.com/guide/h_categories.html

Now we may want to bring MS folder structure into AmiBroker’s category system. Sometimes data vendor would prepare appropriate automation scripts to do that work for us, but when they are not available, we can arrange the categories ourselves in the initial setup process.

To do so, we could pick the folders one-by-one, then reassign the symbols to desired categories. The process is the following:

First we configure the database:

  • Select File->New->Database menu
  • Enter the folder name and press Create
  • Choose MetaStock plugin as the datasource
  • Press Configure

MS plugin config

Now we pick single MetaStock folder (AmiBroker allows to import them all at once, however we want to avoid mixing the symbols from various folders) and press Retrieve button.

MS plugin config

After pressing Retrieve we can close the database configuration dialog (OK, then OK again), go to Symbol->Organize Assignments and reassign the newly imported symbols from Undefined market or Industry into our desired location.

MS plugin config

Now we can return to File->Database Settings->Configure, retrieve another folder and repeat the assignment for that folder and so on and so on.

It is important to mention that this is just one-time procedure. After it is done, AmiBroker will automatically read all updates directly from MetaStock files.

There are also data-vendors offering data in MS format (such as PremiumData for example) that deliver ready-to-use configuration scripts – in such case it would allow to avoid such manual setup procedure and synchronize all category assignments automatically.