amibroker

HomeKnowledge Base

Drawing indicators on a subset of visible bars

By default, the Plot function draws the graph for all visible bars. In some situations however, we may want to draw some selected bars, leaving remaining chart space unaffected.

To achieve that – we simply assign Null value for the bars that we want to skip. Our graph will just be drawn for the non-null bars.

This simple example draws candlesticks only on Mondays and leaves empty all the other days.

IsMonday DayOfWeek() == 1;
// assign Close for Mondays, otherwise assign Null
Data IIfIsMondayCloseNull );
// plot the data
PlotData"Chart of Mondays"colorDefaultstyleCandle )

The following example shows how to restrict the visibility to last N bars. The code defines a custom function, which can be called later on for the arrays we want to show only partially.

// custom function definition
function LastNBars( array, bars )
{
    
bi BarIndex();
    
lvbi LastValuebi );

    
// use Null value for bars other than last N
    
return IIfbi lvbi bars, array, Null );
}

// price plot
PlotClose"Close"colorDefaultstyleBar );

// MA-50 restricted to last 10-bars only
line MAClose50 );
PlotLastNBarsline10 ), "last 10 bars"colorRed );

// shaded area
PlotLastNbarsTrue10 ), ""colorYellowstyleArea|styleOwnScale|styleNoLabel010, -)

Draw chart only for last N bars

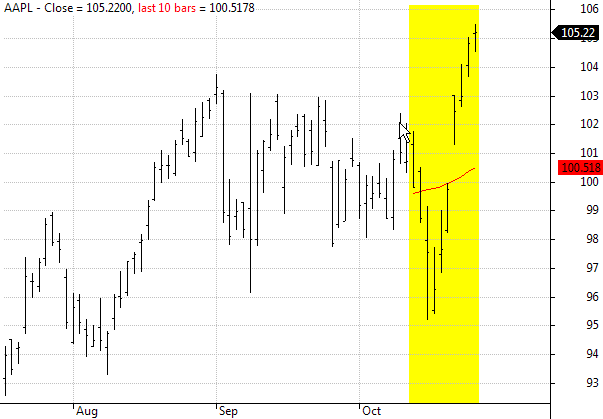
In the above chart both Moving average (red line) and yellow shading area have been restricted to last 10-bars only.

In a similar way we can restrict the visibility to most recent day only in intraday chart:

// custom function definition
function ShowLastDay( array )
{
    
dn datenum();
    
lastDay dn == LastValuedn );

    return 
IIflastDay, array, Null );
}

// price plot
PlotClose"Close"colorDefaultstyleBar );

// daily high / low on last day only
dailyH TimeFrameGetPrice("H"inDaily );
dailyL TimeFrameGetPrice("L"inDaily );
PlotShowLastDaydailyH ), "dailyH"colorGreenstyleThick  );
PlotShowLastDaydailyL ), "dailyL"colorRedstyleThick  );

// shaded area
colorPaleYellow ColorBlend(colorWhitecolorYellow0.1);
style styleArea styleOwnScale styleNoLabel;
PlotShowLastDay), ""colorPaleYellowstyle010, -)

Draw chart only for last day

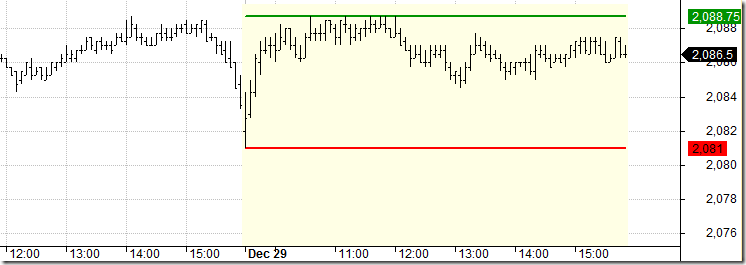
Other practical implementations of such technique is presented in these formulas:
http://www.amibroker.com/kb/2007/03/24/how-to-plot-a-trailing-stop-in-the-price-chart/
http://www.amibroker.com/kb/2014/10/10/how-to-draw-regression-channel-programatically/

How to increase font size for UI elements

In order to change / increase font size used for AmiBroker user interface elements, we can choose one of the following solutions:

  1. Set higher DPI in Windows Control Panel, or
  2. Set font size for individual UI elements such as list views using Windows Control Panel,

To set higher DPI in Windows Control Panel, follow the instructions below.

If you are using Windows 7 or Windows 8:

Open Screen Resolution by clicking the Start button, clicking Control Panel, and then under Appearance and Personalization, click Adjust screen resolution. Then click Make text and other elements larger or smaller

Control Panel

Now set the size of fonts choosing Medium or Larger in order to increase fonts globally.

Control Panel

For Windows XP – please follow the Microsoft documentation presented here:
https://www.microsoft.com/resources/documentation/windows/xp/all/proddocs/en-us/display_use_large_or_small_fonts.mspx?mfr=true

It is also possible to avoid changing all fonts globally and enlarge fonts e.g. for list views only. This can be done by adjusting the default icon system font in Control Panel.

If you are using Windows 8:

the Icon font can be changed in the same dialog as DPI settings discussed previously:

Control Panel

If you are using Windows 7:

In order to access the respective dialog – click on the desktop area with right-mouse button, click Personalize in the context menu, click on Window Color, then click on Advanced appearance settings option at the bottom.

Alternatively, navigate to Control Panel and in the search field in the top-right corner enter ‘window color’ – then pick Change window colors and metrics from the search results.

Then adjust Icon font in the Window Color and Appearance window as shown below:

Window Color and Appearance

For Windows XP – the procedure to get to the dialog is explained here:
http://windows.microsoft.com/en-us/windows-xp/help/setup/personalize-windows-xp

Finally, if we just want to change fonts used by the charts, i.e. X/Y axis, Title and text tool font – it is definable directly in Tools->Preferences->Miscellaneous, Axis font field.

If we want to change AFL Formula Editor font, it can be set in Tools–>Preferences–>Editor page.

Importing data using multiple column separators

When we import data from ASCII (plain text) files, sometimes the data in the input files are arranged in columns separated by different characters. This article shows how to configure Import Wizard / ASCII Importer to import such data correctly.

Let us consider data file using the following format

Ticker,Date/Time,Open,High,Low,Close,Volume
EURUSD,2011-06-13 20:19:00,1.4421,1.4421,1.4419,1.4419,332
EURUSD,2011-06-13 20:20:00,1.4419,1.4419,1.4418,1.4418,298
EURUSD,2011-06-13 20:21:00,1.4418,1.4418,1.4416,1.4417,192

In this sample data file columns are separated with a comma, with one exception – date and time columns are combined together, with a space in between. ASCII importer requires us to specify Date and Time columns separately. Fortunately – there is a way to treat space and comma both as separators at the same time.

To configure Import Wizard, we need to specify columns to match the input data, treating Date and Time as two separate columns (Column 2 and Column 3 in this case), additionally we need to set Separator field as Comma or Space, so the importer would properly recognize space as a character delimiting the new column.

Import Wizard

This way our data will be imported properly. There are also other multiple separator choices available in the Import Wizard, such as Tab or Space and Semicolon or Space that can be used if your data file uses tabs or semicolons as primary column separator.

If we build our import definition file manually for ASCII importer, we can also specify multiple separators, by enclosing the required characters in quotation marks in $SEPARATOR command. The equivalent format definition for the above input data would look like this:

$FORMAT Ticker, Date_YMD, Time, Open, High, Low, Close, Volume
$SKIPLINES 1
$SEPARATOR ", "
$CONT 1
$GROUP 255
$AUTOADD 1
$DEBUG 1

More information about ASCII importer and Import Wizard functionalities can be found in the manual:
http://www.amibroker.com/guide/w_impwizard.html
http://www.amibroker.com/guide/d_ascii.html

Using multiple watchlists as a filter in the Analysis

The Filter window in the Analysis screen allows us to define a filter for symbols according to category assignments, for example watchlist members (or a result of mutliple criteria search).

The filter allows us to select one watch list for “inclusion” and one for “exclusion”. To include members of more than one watchlist, we can not simply pick them both in the Filter window – we need to combine these symbols together in another dedicated watchlist storing symbols from both lists.

Let us say we want to run a test on members of List 1 and List 2. To combine these watchlists together we need to follow the instructions below.

  1. Click on List 1, then in the bottom part of the Symbols window mark all tickers. A multiple selection is done by clicking on first and last item in the list while holding down the Shift key. We may also select all symbols by clicking on any symbol and pressing Ctrl+A key.

    Select symbols from watch list

  2. Now click on the selection with right mouse button and choose Watch list->Add selected symbol(s)

    Add symbols to watch list

  3. Pick an empty watchlist that we will use to combine our tickers (e.g. List 5 ) and confirm to add multiple symbols:

    Confirm adding multiple symbols

  4. Repeat the above steps 1-3 with List 2 members
  5. Now we can pick List 5 in the Filter window and run the test on all the tickers

    Create new watch list

An alternative solution to this is to filter out unwanted symbols in the code. In this case AmiBroker would need to run analysis for all tickers (so Apply to would need to be set to All symbols) and apply filtering while executing your formula. To do so you may use code like this for backtesting (filtering Buy signals):

Buy /* your regular trading rules here */;

watchlistCheck InWatchList) OR InWatchList);
Buy watchlistCheck  AND Buy// combine watch list filter with your rule

or code like this in exploration (adding extra condition to Filter variable):

Filter /* your regular exploration filter here */;
watchlistCheck InWatchList) OR InWatchList);
Filter watchlistCheck AND Filter// combine watch list filter with your rule

Please keep in mind that filtering in the code is significantly slower. Using this method AmiBroker needs to read the data for all tickers, prepare arrays, then evaluate the formula and verify the condition – so using Filter window and the first approach will be faster, as the filtering is done before the formula execution, saving lots of time required for data retrieval and AFL execution.

Text output in Explorations

Explorations allow to display not only numerical data but also text, there are however certain restrictions what can and can’t be displayed in the exploration result list as a text.

AddTextColumn() function allows to display strings, so we can use it for displaying e.g. full name of the symbol or category assignment information:

Filter 1;
AddTextColumnFullName(), "FullName");
AddTextColumnSectorID(1), "Sector");
AddTextColumnIndustryID(1), "Industry");
AddColumnClose"Close")

Exploration Text output

It is worthwhile to note that these strings displayed above do not vary across historical bars. That is important, because there is no such structure in AFL as an ‘array of strings’, therefore an attempt to generate a text, which varies on each bar will not work. Instead a string representing selected array value (or last value) will be displayed.

Let us check such a formula to illustrate the above statement:

condition Close Open;

Filter 1;
AddColumnOpen"Open" );
AddColumnClose"Close" );
AddColumncondition"Condition"1.0);

// WriteIf returns a SINGLE STRING representing condition at last bar of selected range
text WriteIfcondition"Close above Open""Close below Open" );
// the text variable represents value AT THE LAST BAR of selected range
AddTextColumntext"text" )

If we look at the output over more than one bar, then we can see that the condition from the last bar determines the text output in the column:

Exploration Text output

Therefore, such approach as above can only be used in situations where we run the exploration applied e.g. to 1-Recent bar, because it’s the last bar from the range which determines the text displayed in the column in such situation.

If you want to display the value for other bars than last bar of selected range, you need an extra column, like this:

condition Close Open;

Filter 1;
AddColumnOpen"Open" );
AddColumnClose"Close" );
AddColumncondition"Condition"1.0);

// WriteIf returns a SINGLE STRING representing condition at last bar of selected range
text WriteIfcondition"Close above Open""Close below Open" );
AddTextColumntext"Last bar text" ); 

// Note that we are now using Ref() function to reference previous bar data
text2 WriteIfRefcondition, -), "Close above Open""Close below Open" );
AddTextColumntext2"Previous bar text" )

You can use functions like Ref() or ValueWhen() to refer to other bar’s data, or you can use array subscript operator like this condition[ 1 ] to get value of condition at bar with index 1.

There is an alternative method to display values that change on bar by bar basis as letters though. Instead of displaying full string we can display single characters in a column using formatChar parameter, as shown in the code below:

Version5.90 ); // only works for version 5.90 and above
Buy CrossMACD(), Signal() );
Sell CrossSignal(), MACD() );

Filter Buy OR Sell;
AddColumnIIfBuy'B''S' ), "Signal"formatChar )

Exploration Text output

Note: If you are using version older than 5.90, you need to use Asc function instead of single-character literals, as shown below:

Buy Cross(MACD(),Signal());
Sell Cross(Signal(),MACD());

Filter Buy OR Sell;
AddColumnIIfBuyAsc("B"), Asc("S")), "Signal"formatChar )

More information about explorations can be found in the manual:
http://www.amibroker.com/guide/h_exploration.html

How to copy backtest trade list to a spreadsheet

There are several ways to transfer the backtest results to a spreadsheet.

  1. Immediately after the test we can just click on the results list with right mouse button and choose Copy from the menu. It is also possible to click on the results and use Ctrl+C key shortcut.

    Copy Trade List

    The operation will copy the entire list, so there is no need to select all rows manually.

  2. After the test, we can also use File->Export option from the main program menu to export the results list to a CSV or HTML file, which could be opened from Excel later on.

    Export Trade List

  3. Backtest results are also accessible through the Report Explorer:

    Backtest Report Explorer

    In order to open detailed report for the particular test it is enough to double-click on the selected line. Then, after we navigate to Trade List page, to copy the results, the best option to use is Edit->Copy Table

    Copy Table

    Unlike the regular Copy option, Copy Table transforms HTML tables into CSV format and copies it into clipboard so tables can be pasted easily to Excel. Also it divides Entry/Exit columns into separate Entry/exit date/price columns.

How to add full name to the Price chart title

The full name of the security can be retrieved in AFL using FullName() function.

In order to add such information to the built-in Price chart, we need to do the following:

  1. Click on the chart with right mouse button
  2. Choose Edit Formula from the context menu
  3. Modify the Title definition line, the built-in code contains:_N(Title StrFormat("{{NAME}} - {{INTERVAL}} {{DATE}} Open %g, Hi %g, Lo %g, Close %g (%.1f%%)",
                         
    OHLCSelectedValueROCC) ) ))

    We need to change it into:

    _N(Title StrFormat("{{NAME}} - " +
                          
    FullName() +
                          
    " - {{INTERVAL}} {{DATE}} " +
                          
    "Open %g, Hi %g, Lo %g, Close %g (%.1f%%) Vol %.0f",
                          
    OHLCSelectedValueROCC) ), ) )
  4. To apply these changes choose Tools->Apply Indicator from the menu.

If we have Full name information imported into the database and visible in Symbol->Information window, the updated chart title will show it next to the ticker name.

Fullname in the chart title

Setting default color for studies

In order to select color before drawing the trendline or other studies it is enough to choose the color in Color Pick (Select color) toolbar button located in the Format toolbar.

Color Pick

This allows to avoid drawing the line and changing color later on in line Properties dialog.

How to backtest symbols individually

By default, when we run backtest over a group or watchlist of symbols – AmiBroker will perform a portfolio test. However, there is also an Individual mode of the backtest available, where every symbol is tested individually and independently.

Once we send the formula to Analysis window and define group of symbols to run code on (Apply To), in order to run an individual backtest, it is necessary to unfold the menu next to Backtest button and choose Individual Backtest from the menu.

Individual Backtest

To get full report generated for each of the tests, it is required to first go to Analysis–>Settings->Report tab and mark Generate detailed reports for each symbol in individual backtests option.

Individual Backtest Report

Then the full reports can be accessed through the Report Explorer.

Report Explorer

The letter I indicates that the report contains results of an individual test. Double-clicking on the particular results line will show full contents of the backtest report.

Report Explorer List

How to display correlation between symbols

For the purpose of calculating the correlation between two data-arrays, there is a Correlation() function in AFL which can be used.

In order to display a correlation chart, please select Analysis–>Formula Editor menu and enter the following code:

SetChartOptions0chartShowArrows|chartShowDates);
Ticker ParamStr"Symbol"Name() );
range Param"Periods"25225001);

corr CorrelationCloseForeignTicker"C"), range );
Plotcorr"Correlation " Name() + "/" ticker,
      
ParamColor"Color"colorRed ), ParamStyle"Style"styleLine ) );

// check if different symbols are used
if( ticker == Name() )
    
Title "Please select different symbol from Parameter dialog"

Now select Tools->Apply Indicator. Initially the code will pick the selected symbol’s Close prices for both arrays, so we either need to change the selected ticker in the chart or the second symbol, which can be defined in Parameters dialog.

We can also use Exploration feature to display a correlation matrix e.g. for the watchlist members. The below example shows the process for Watchlist 0 members.

The formula to display correlation table looks as follows:
// read the list of symbols from Watchlist 0
symlist CategoryGetSymbolscategoryWatchlist);

// display only last bar from the Analysis range
Filter Status"lastbarinrange" );

// iterate through symbols
for ( 0; ( sym StrExtractsymlist) ) != ""i++ )
{
    
// calculate correlation over 252 bars
    
Corr CorrelationCForeignsym"C" ), 252 );

    
// set color dynamically based on correlation values
    // and display the output in exploration column
    
Clr 32 SelectedValueCorr ) * 32;
    
AddColumnCorrsym1.2,
               
ColorHSB128 Clr255255 ),
               
ColorHSBClr255255 ) );
}

SetSortColumns)

To use the formula we need to do the following:

  1. assign some symbols to watchlist 0
  2. select Analysis->Formula Editor menu
  3. in the AFL Editor enter the code listed above
  4. select Tools->Send to Analysis menu
  5. in the Analysis window, select Apply to: Filter (in Include tab hit Clear and pick watchlist 0)

    Filter dialog

  6. select Range: 1 Recent bar (in case of longer range, last bar of the range will be used for output)
  7. press Explore button

Here is a sample output table:

Correlation Matrix

Be careful and try not to put 10000 items in the watch list because it would need to create a table with 10K columns. Windows has some limits on pixel width of the list view and it would truncate display when the display width (scrollable area inside list) exceeds 32767 pixels. That makes it practical only to display matrices of not more than about 1000-2000 columns.

Next Page »