amibroker

HomeKnowledge Base

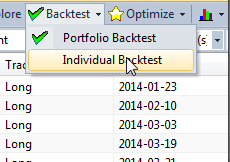
How to manage overlapping entry/exit signals in portfolio test

When we run the portfolio-test and use default backtesting procedure – on each bar AmiBroker will first process exit signals, then use entry signals to open new trades.

There may be some strategies however, where this approach may not be enough. For example – if we simulate entries with limit price (so they occur somewhere in the middle of the day), but exits on Close – then if we do not use any margin loan, the funds from exit signals can only be used on subsequent days.

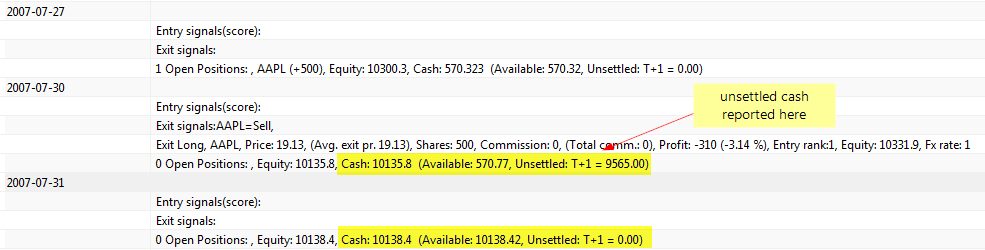
Since trading prices (BuyPrice, SellPrice, ShortPrice, CoverPrice arrays) don’t carry any timing information, but only the information about price level for given trade – then we need to delay release of funds by one day to get correct results. This can be done with the following command:
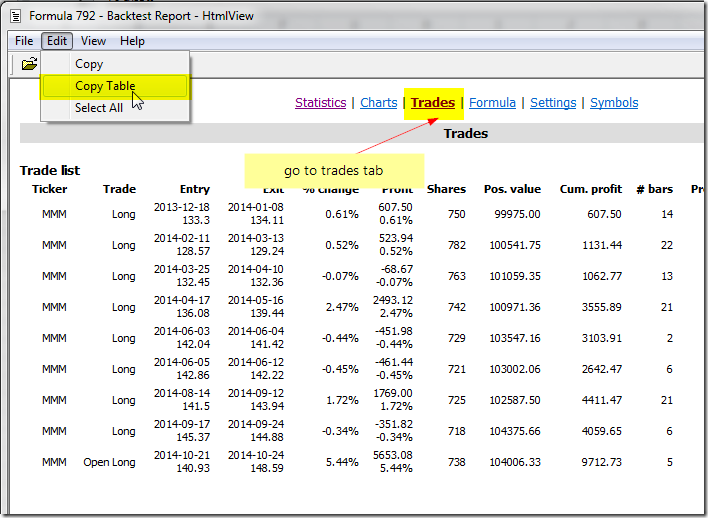
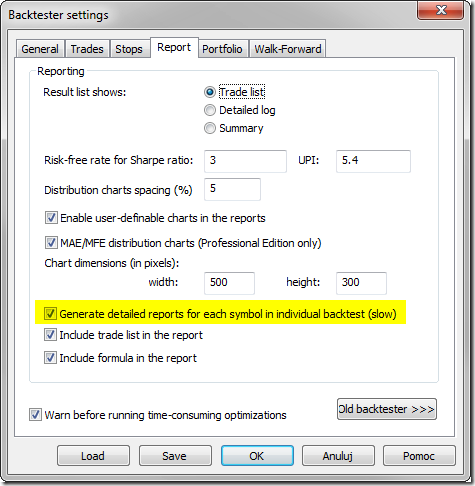
SetOption("SettlementDelay")

The unsettled cash is reported in the Detailed Log:

Detailed log

We need to remember that this option works on Days (not bars) and it may be better to use it with backtestRegularRaw instead of backtestRegular, otherwise some trades may not be entered because funds are not settled immediately – so we may need to be able to enter not on first but subsequent buy signals (all would really depend on the particular trading rules) – the behaviour of backtestRegular mode and processing raw signals is explained here: http://www.amibroker.com/guide/h_portfolio.html

Using Exclude statement to skip unwanted optimization steps

Sometimes when we optimize our system, we may want to use only a subset of all parameter permutations for our analysis and ignore the others that do not meet our requirements.

For example – if we test a simple trend-following strategy, where we enter long position when short MA crosses above long MA using code such as:

shortPeriods Optimize("Short MA"1011001);
longPeriods Optimize("long MA"5011001);

Buy CrossMACloseshortPeriods), MACloselongPeriods) );
Sell CrossMACloselongPeriods), MACloseshortPeriods) )

Then, shortPeriods parameter value should remain smaller than longPeriods, otherwise the trading rules would work against the main principle of the tested strategy.

There is an easy way to ignore the unwanted sets of parameters by using Exclude statement in our code. If the variable is true – the backtester will not calculate any statistics for that particular run:

shortPeriods Optimize("Short MA"1011001);
longPeriods Optimize("long MA"5011001);

Buy CrossMACloseshortPeriods), MACloselongPeriods) );
Sell CrossMACloselongPeriods), MACloseshortPeriods) );

Exclude shortPeriods >= longPeriods

The information from Info tab of Analysis window shows the difference between first execution (all 10000 backtest runs) and second one using Exclude statement. Note reduced number of steps and reduced optimization time.

Exclude results

How to add MAE / MFE dates to the backtest report

If we want to identify dates, when MAE and MFE levels have been reached during the trade lifetime – we can use the code example presented below.

The formula will process the trades one-by-one, read BarsInTrade property to know how many bars it took since trade entry till exit, then use HHVBars / LLVBars functions to identify how many bars have passed since lowest low or highest high within trade length.

With the information that highest or lowest value was observed N-bars ago – it will shift Date/Time array accordingly – so with use of Lookup() function pointing at the exitbar – we can read the date when HHV/LLV was observed within trade lifetime (BarsInTrade).

SetCustomBacktestProc"" );

function 
processTradetrade )
{
    
dt DateTime();

    
SetForeigntrade.Symbol );

    
llvDate LookupRefdt, - LLVBarsLowtrade.BarsInTrade ) ), trade.ExitDateTime );
    
hhvDate LookupRefdt, - HHVBarsHightrade.BarsInTrade ) ), trade.ExitDateTime );

    if ( 
trade.IsLong() )
    {
        
maeDate llvDate;
        
mfeDate hhvDate;
    }
    else
    {
        
maeDate hhvDate;
        
mfeDate llvDate;
    }

    
RestorePriceArrays();

    
trade.AddCustomMetric"MFE Date"DateTimeToStrmfeDate ) );
    
trade.AddCustomMetric"MAE Date"DateTimeToStrmaeDate ) );
}

if ( 
Status"action" ) == actionPortfolio )
{
    
bo GetBacktesterObject();

    
bo.Backtest); // run default backtest procedure

    
for ( trade bo.GetFirstTrade(); tradetrade bo.GetNextTrade() )
    {
      
processTradetrade );

    }

    for ( 
trade bo.GetFirstOpenPos(); tradetrade bo.GetNextOpenPos() )
    {
      
processTradetrade );
    }

    
bo.ListTrades();
}

Buy CrossMACD(), Signal() );
Sell CrossSignal(), MACD() )

How to use custom backtest metric as an optimization target

In Optimization and Walk Forward testing AmiBroker allows us to choose the optimization target that determines optimum values of optimized parameters. This can be done in Analysis->Settings->Walk Forward tab and the drop down list contains a list of built-in statistics to choose from:

Walk forward settings

However, we are not limited to built-in metrics only. Custom Backtester Interface allows us to add any custom statistics to the backtest/optimization reports and we can use these metrics for optimization too.

To do that, we first need to add a custom metric (this article explains how to do it: http://www.amibroker.com/guide/a_custommetrics.html). Then – we need to type-in our metric name into the Optimization Target box:

Walk forward settings - custom metric

The name we enter must be an exact match of the metric name we have defined in AddCustomMetric() method. If entered name can not be found in the Optimization result table, then Net Profit will be used instead.

How to display interest gains in the backtest report

The default backtest report shows total Net Profit figure, which includes both trading profits and interest earnings. With Custom Backtest procedure we can easily isolate these components by summing up profits and loses from individual trades, then subtracting trading gains from the Net Profit and report them as separate metrics.

SetCustomBacktestProc"" );

if ( 
Status"action" ) == actionPortfolio )
{
    
bo GetBacktesterObject();
    
bo.Backtest(); // run default backtest procedure

    // read Net Profit, Winners and Losers profits from the report
    
st bo.GetPerformanceStats);
    
netProfit st.GetValue"NetProfit" );
    
tradeProfits st.GetValue("WinnersTotalProfit") + st.GetValue("LosersTotalLoss");

    
bo.AddCustomMetric"Trading profits"tradeProfits );
    
bo.AddCustomMetric"Interest earnings"netProfit tradeProfits );

}

// trading rules here
Buy CrossMACD(), Signal() );
Sell CrossSignal(), MACD() )

After backtest is run, we can see our custom metrics in the backtest report.

More information about creating custom metrics can be found in the manual:
http://www.amibroker.com/guide/a_custommetrics.html

Using optimum parameter values in backtesting

After Optimization process has found optimum values for parameters of our trading system, typically we want to use optimum values in subsequent backtesting or explorations. In order to achieve that, we need to manually update default_val (second) argument of Optimize function with the values obtained from the optimization report.

The arguments of Optimize function are shown below (note second parameter marked in dark red color – this is the default value parameter we will be changing after optimization run):

some_var = Optimize( "description", default_val, min_val , max_val, step );

Let us consider the following example formula used for optimization process:

SetOption("ExtraColumnsLocation"1);
periods Optimize"Periods"2550); // note that default value is 2
Level Optimize"Level"22150); // note that default value is 2

Buy CrossCCIperiods ), -Level );
Sell CrossLevelCCIperiods ) )

If we perform Optimization process and check the results (for this example we use Net Profit as the optimization target), we can see that the best results use Periods = 6 and Level = 126.

Optimization result

Now in order to run backtest and obtain exactly the same results as in the respective line of the above Optimization results, we need to enter the values into default argument, so the modified code will look like this:

SetOption("ExtraColumnsLocation"1);
periods Optimize"Periods"6550); // we changed default value to 6
Level Optimize"Level"1262150); // we changed default value to 126

Buy CrossCCIperiods ), -Level );
Sell CrossLevelCCIperiods ) )

Now we can use the code with modes other than Optimization and the formula will use optimized values we retrieved from the results.

How to copy backtest trade list to a spreadsheet

There are several ways to transfer the backtest results to a spreadsheet.

  1. Immediately after the test we can just click on the results list with right mouse button and choose Copy from the menu. It is also possible to click on the results and use Ctrl+C key shortcut.

    Copy Trade List

    The operation will copy the entire list, so there is no need to select all rows manually.

  2. After the test, we can also use File->Export option from the main program menu to export the results list to a CSV or HTML file, which could be opened from Excel later on.

    Export Trade List

  3. Backtest results are also accessible through the Report Explorer:

    Backtest Report Explorer

    In order to open detailed report for the particular test it is enough to double-click on the selected line. Then, after we navigate to Trade List page, to copy the results, the best option to use is Edit->Copy Table

    Copy Table

    Unlike the regular Copy option, Copy Table transforms HTML tables into CSV format and copies it into clipboard so tables can be pasted easily to Excel. Also it divides Entry/Exit columns into separate Entry/exit date/price columns.

How to backtest symbols individually

By default, when we run backtest over a group or watchlist of symbols – AmiBroker will perform a portfolio test. However, there is also an Individual mode of the backtest available, where every symbol is tested individually and independently.

Once we send the formula to Analysis window and define group of symbols to run code on (Apply To), in order to run an individual backtest, it is necessary to unfold the menu next to Backtest button and choose Individual Backtest from the menu.

Individual Backtest

To get full report generated for each of the tests, it is required to first go to Analysis–>Settings->Report tab and mark Generate detailed reports for each symbol in individual backtests option.

Individual Backtest Report

Then the full reports can be accessed through the Report Explorer.

Report Explorer

The letter I indicates that the report contains results of an individual test. Double-clicking on the particular results line will show full contents of the backtest report.

Report Explorer List

How to restrict trading to certain hours of the day

In order to include time-based conditions in the back-testing code – we can use TimeNum() function to check the time-stamp of given bar and use it as input for any time-based conditions.
http://www.amibroker.com/f?timenum

In order to code a strategy that triggers trades only in certain hours of the day, 9:30-11:00 in this example, we can use the following approach (code uses simple MACD crossovers to generate signals):

tn TimeNum();
startTime 93000// start in HHMMSS format
endTime 110000;  // end in HHMMSS format
timeOK tn >= startTime AND tn <= endTime;

Buy CrossMACD(), Signal() ) AND timeOK;
Sell CrossSignal(), MACD() ) AND timeOK

It is also possible to force an exit signal after 11:00 to avoid overnight positions:

tn TimeNum();
startTime 93000// start in HHMMSS format
endTime 110000;  // end in HHMMSS format
timeOK tn >= startTime AND tn <= endTime;

Buy CrossMACD(), Signal() ) AND timeOK;
Sell = (CrossSignal(), MACD() ) AND timeOK) OR CrosstnendTime ); 

How to synchronize backtesting setup on different computers

When comparing the output of back-tests obtained from different working machines, it is necessary to make sure that all aspects of our testing are identical, including:

  1. the database
  2. the formula used for testing
  3. the settings

In order to synchronize data – the best is to copy the entire local database folder. Using just the same data source, especially if it is real-time feed may not be enough due to different array lengths or some corrections that may have been applied in historical data on data-vendors server in between.

In case of any differences in results between two computers that is the very fist thing to check, as different input would result in different output.

To find out that the data are different you may simply create a checksum of data columns, using code like shown below:

Filter Status("lastbarinrange");
AddColumnCumHigh Low Close Open ), "Price checksum");
AddColumnCumVolume ), "Volume checksum" );
AddColumnBarIndex(), "Number of bars");
AddSummaryRows); // add total sum of column

By running this code on both computers you can compare checksums to see if they are the same.

In order to transfer the formula and settings to the other machine it is enough to:

  1. select Analysis window
  2. use File->Save from the main menu and save the APX file
  3. open the same APX file on the other computer

If data, code and settings are identical, then the obtained results will also stay in sync.

« Previous PageNext Page »