October 6, 2017
Limits of multithreading
From time to time users approach us asking various questions related to multithreading such as:
- Why his/her formula does not run 32 times faster on 16 core / 32 thread computer
- Will 16 core processor be twice as fast as 8 core
- Why their CPU does not show 100% usage?
The reason of all those questions is lack of understanding of multithreading and laws governing computing in general.
In this article we will try to address some of those misunderstandings and misconceptions. We assume that the reader already read Efficient use of multitreading from AmiBroker’s Users’ guide and is fully aware how work is distributed in many threads in the Analysis window. We also assume that the reader already read Peformance Tunning chapter of AmiBroker’s guide. These two parts of the manual explain fundamental concepts and are essential to understanding of what is written below.
Another fundamental reading is Amdahl’s Law article in the Wikipedia that explains theoretical speedup limit of any multi-threaded program. In short Amdahl’s law says that if 95% of your program runs in multiple threads and only 5% of it is serial (single-threaded), the maximum achievable speedup regardless of how many CPUs and how many cores you have is 20x (20 times).
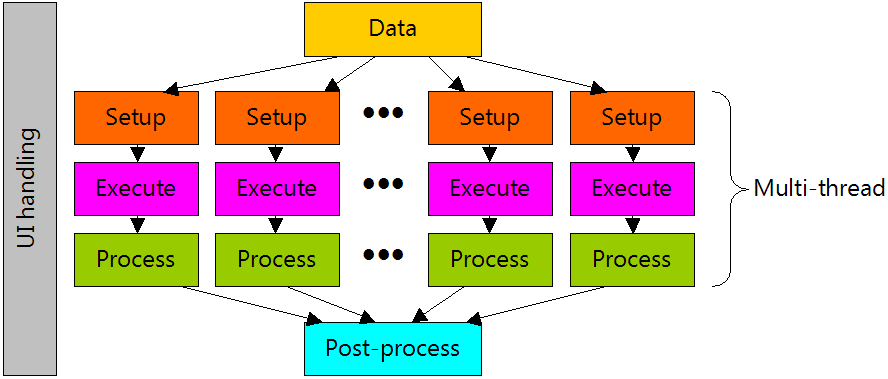
Let us focus on Analysis window performance (Exploration/Scan/Backtesting/Optimization). Any operation in the Analysis window involves:
- preparing data (this involves reading data from the database, data compression to selected interval, filtering, padding, etc)
- setting up AFL engine for execution (setting up built-in arrays, stops, parsing of your formula)
- execution of your formula (in backtest for example it means first phase of backtest run, done on every symbol)
- per-symbol processing the output of your formula (in backtest it is sorting signals by position score)
- post-processing (in case of portfolio backtest it is for example portfolio backtest phase that is done once per backtest, NOT for every symbol)
AmiBroker is highly parallel multithreading application, so most of steps are done in multiple threads. Specifically only first and last (1. and 5.) step is serial, the rest (2, 3, 4) is parallel. It is worth noting that steps 1-4 are done on every symbol, while step 5 is only done once for all symbols. In addition to that program spends some time handling the UI (things like updating UI controls like progress bar and reacting to your mouse / keyboard input) which is of course done in single (main) UI thread.
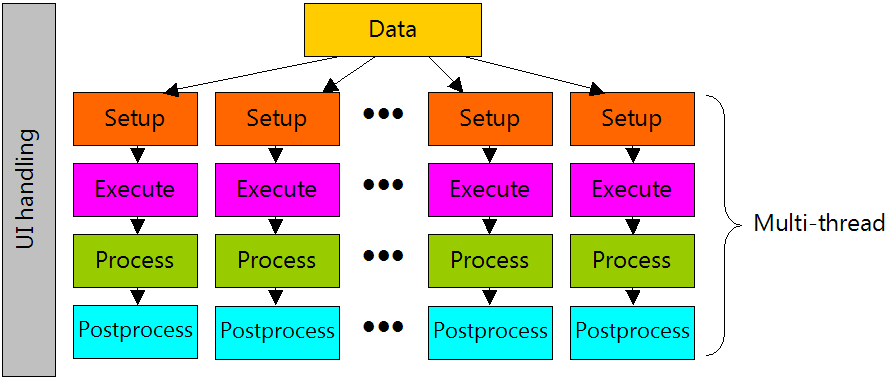
There is one exception, a special case: Individual optimization. In individual optimization step 1 is done only once (for one symbol), and all other steps 2-5 (so including last one) are done in multiple threads.
Now is where Amdahl’s law kicks in. By adding threads/cores/processors you can only decrease parallel parts (2..4 or 2..5) and ultimately you are limited by the speed of data access. You can’t backtest faster than you can read/prepare the data.
As for data access: the database is shared resource, no matter where it resides. If it resides on hard disk, it is single physical device that does not speed up with increasing number of CPUs. If it resides in RAM, it is still single physical RAM, that has limit on bandwidth and fixed latency regardless how many processors you throw to the mix. Even if it is in L3 (Level 3) cache on the processor, it is still single L3 cache shared by multiple cores. And it is worth nothing, that L3 cache even on most modern processors operate on half the speed of the core, so single core can actually saturate bandwidth of L3 cache if doing nothing but reading or writing large chunks of data from/to it. In many cases this means that processor must wait for memory, unless it is doing complex computations involving only minimum amount of data. These are for example real-world measurement results for triple channel RAM controller on Intel i7 920 CPU (measured using memtest86 program)
| Data location | Bandwidth [MB/sec] |
| L1 | 52408 |
| L2 | 30722 |
| L3 | 24521 |
| RAM | 11879 |
Only L1 cache runs at full core speed. As you can see L3 cache has half the bandwidth and RAM has 1/4 of bandwidth of L1 cache. Of course disk speeds (even SSD) are far cry behind 11GB/sec offered by RAM.
In case of portfolio backtest: a final backtest phase (portfolio backtesting) is one per backtest, done once for all symbols, so naturally it is done in single thread (as opposed to first phase that is done on every symbol in parallel).
Now, knowing this all you may wonder how to use all that knowledge in practice.
For example it allows to understand the limits of achievable speed gains for given formula and plan your hardware purchases or find ways to improve run times.
As we learned from the above the only parts that can be speed-ed up by adding more cores are those that are run in parallel (multiple threads). In practice it means – your AFL formula code. What is more the more time is spent in parallel part the better it scales on multiple cores. This means that simple formulas DO NOT scale too well because they are too simple to put enough strain on CPU and are mainly memory (data access) bound. All your simple moving average cross overs are just too simple to keep CPU busy for longer time, especially when there is not too much data to process.
Let us take this trivial formula for example:
period = Optimize( "period", 10, 2, 102, 1 );
Buy = Cross( C, MA( C, period ) );
Sell = Cross( MA( C, period ), C )
and run Optimize->Individual Optimize on symbol that has 2000 quotes.
Now switch to “Info” tab in the Analysis window and you will see this output (this example comes from 4 core / 8 thread Intel i7), all times are in seconds:
Individual optimize started.
Completed in 0.49 seconds. Number of rows: 500
( Timings: data: 0.11, setup: 0.00, afl: 0.28, job: 2.97, lock: 0.00,
pbt: 0.00, UI thread: 0.11, worker threads: 3.26/3.26 )
So our 500 step optimization on 2000 quotes took less than half of the second. What you see there are some cryptic numbers that you might wonder what they mean. Here is the explanation (for the backtest/optimization)
a) data – time spent accessing/preparing the data
b) setup – time spent preparing AFL engine
c) afl – time spent executing your formula (first phase of backtest)
d) job – post processing (here signals are collected and trading simulation is performed in case of individual optimize)
e) lock – time spent waiting in critical section / lock accessing shared signal table
f) pbt – portfolio backtesting code (not used in individual optimization)
g) UI thread – time spent in UI thread in total (data + pbt + UI handling) – single threaded time
h) worker threads – time spent in worker (parallel) threads (setup+afl+job+lock) – multi-threaded time
Firstly it may look surprising that “worker threads” time is 3.26 which is way longer than entire optimization took (0.49 seconds). But this time is a SUM of times spent in all 8 threads. They ran in parallel. Each was running for (3.26/8 seconds = 0.4075 seconds), and with only one thread running it would take 3.26s. Now you suddenly realize the power of multi-threading!
So now it would seem that our formula run (0.11 + 3.26)/0.49 = 6.8 times faster than on single core.
You may ask why not 8x? We had 8 threads, didn’t we?
First reason is the Amdahl’s law – serial time (0.11sec) is constant and limits our speed up, no matter how many threads you would put on it, but there is something more.
Let us check how much time would it really take if we limited to one thread only. Try running with #pragma statement limiting number of threads:
#pragma maxthreads 1
period = Optimize( "period", 10, 2, 102, 1 );
Buy = Cross( C, MA( C, period ) );
Sell = Cross( MA( C, period ), C )
Suddenly the result is:
Individual optimize started.
Completed in 1.62 seconds. Number of rows: 500
( Timings: data: 0.07, setup: 0.00, afl: 0.10, job: 1.37, lock: 0.00,
pbt: 0.00, UI thread: 0.07, worker threads: 1.47/1.47 )
What? Entire optimization took just 1.62 seconds when run in single-thread which is just 3.3 times slower than multi-threaded, not 6.8x as we calculated earlier. Why worker thread is 1.47 ? It was 3.26? What happened?
There are couple of reasons for that:
a) Hyper-threading – as soon as you exceed CPU core count and start to rely on hyperthreading (running 2 threads on single core) you find out that hyperthreading does not deliver 2x performance. If your code is NOT doing complicated things like lots of trigonometric functions that put FPU busy or other number crunching, the hyperthreading will not give you 2x performance. On simple tasks it struggles to deliver +30%.
b) Turbo boost – modern CPUs have different settings for single-core turbo boost and multi-core turbo boost. The effect is that CPU can reach raise clock to 4GHz when running single-core only but limit to 3.5GHz when running multi-threaded code. This limits multi-threaded performance and speeds up single-thread apps
c) Concurrent L3 cache / RAM access – when multiple cores run the code accessing L3 cache / RAM they will fight for access slowing them down
The effect of all three factors is amplified by the fact that our formula is extremely simple and does NOT do any complex math, so it is basically data-bound. This is why single-core execution was not as bad as we expected.
But what would happen if we increase the number of bars (keeping formula the same)? Let us try with 12000 bars of data (6 times more data than previously):
8-threads:
Individual optimize started.
Completed in 1.61 seconds. Number of rows: 500
( Timings: data: 0.18, setup: 0.00, afl: 0.81, job: 11.57, lock: 0.00,
pbt: 0.00, UI thread: 0.19, worker threads: 12.38/12.38 )
1-thread:
Individual optimize started.
Completed in 6.90 seconds. Number of rows: 500
( Timings: data: 0.10, setup: 0.00, afl: 0.28, job: 6.48, lock: 0.00,
pbt: 0.00, UI thread: 0.10, worker threads: 6.76/6.76 )
First we observe that although we used 6x more data, the time in multi-threaded case has increased from 0.49 to 1.61 which is only 3.28x. Secondly we see that 8-threaded execution is now 6.90/1.61 = 4.29 times faster than single-threaded.
What happened that multi-threaded performance is now better and it scales better?
Simply – we loaded CPU with more work. That is general rule, the more work you place on the CPU, the more time is spent in parallel section and more gain you get from multi-threading.
So, what would happen if you put CPU to some really heavy-work. It is surprisingly difficult to put i7 CPU into such a hard work that it sits busy doing calculations and not doing too much memory access. You would really need to use functions that do heaps on calculations on very small chunks of data sitting in L1 cache all the time or use some transcendental math functions that require FPU to spend way more than single cycle to derive result. Let us try with combination of raising to power, decimal logarithm and arcus sine.
period = Optimize( "period", 10, 2, 501, 1 );
Buy = Cross( C, MA( C, period ) );
Sell = Cross( MA( C, period ), C );
// add some math to force i7 CPU to sweat a little bit
for( i = 0; i < 100; i++ ) x = acos( log( C ^ period ) )
Once you to run this you will see AmiBroker saturating your CPU (on my end it uses 99% of CPU) for the first time. The results are:
8 threads:
Individual optimize started.
Completed in 39.39 seconds. Number of rows: 500
( Timings: data: 0.14, setup: 0.00, afl: 302.73, job: 9.14, lock: 0.00,
pbt: 0.00, UI thread: 0.14, worker threads: 311.87/311.87 )
1 thread:
Individual optimize started.
Completed in 251.27 seconds. Number of rows: 500
( Timings: data: 0.12, setup: 0.00, afl: 243.92, job: 6.59, lock: 0.00,
pbt: 0.00, UI thread: 0.12, worker threads: 250.51/250.51 )
Now you can see that 8 threaded execution was (251.27/39.39) 6.38 times faster than single-threaded.
This is almost perfect scaling with hyperthreading – remember hyper-threaded thread is NOT fast as separate-core thread. To prove that we can run same code on 4 threads:
#pragma maxthreads 4
period = Optimize( "period", 10, 2, 501, 1 );
Buy = Cross( C, MA( C, period ) );
Sell = Cross( MA( C, period ), C );
// add some math to force i7 CPU to sweat a little bit
for( i = 0; i < 100; i++ ) x = acos( log( C ^ period ) )
With four threads we get:
Individual optimize started.
Completed in 64.63 seconds. Number of rows: 500
( Timings: data: 0.13, setup: 0.00, afl: 250.22, job: 6.91, lock: 0.00,
pbt: 0.00, UI thread: 0.13, worker threads: 257.12/257.12 )
So 4-thread performance was 251.27/64.63 = 3.89 faster than single-thread. And look at the “worker threads” time it is very close to single-thread time (250s vs 257s). This proves our point that except the effect of RAM and L3 congestion and slightly slower turbo boost speed, full-core threads scale perfectly as long as your formula puts them into some real work.
Note: in all those tests we did NOT include the impact of disk speed because we run single-symbol individual optimization which runs out of RAM.
Bottom line is: despite marketing hype buying 32 thread CPU does not buy you 32x performance. Real-world performance depends on many factors including formula complexity, whenever it is heavy on math or not, amount of data, RAM speed, on-chip cache sizes, turbo boost clocks differences between single-thread and multi-thread configurations and so on. The devil is in the details and there are no simple answers. I always say: do not assume. Assumptions are not facts. Unless you measure something you don’t know.
 Filed by Tomasz Janeczko at 6:25 pm under Analysis,Backtest
Comments Off on Limits of multithreading