amibroker

HomeKnowledge Base

Using price levels with ApplyStop function

ApplyStop function by default requires us to provide stop amount (expressed in either dollar or percentage distance from entry price). Therefore, if we want to place stop at certain price level, then we need to calculate the corresponding stop amount in our code.

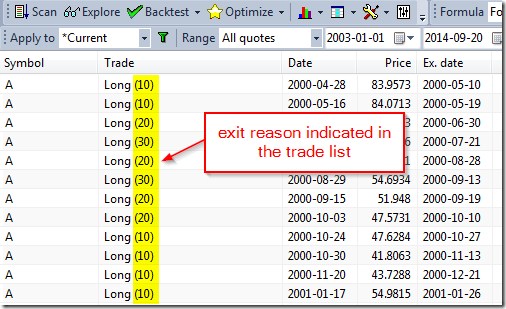
This example shows how to place stops at previous bar Low (for long trades) and previous bar High (for short trades).

Stop amount parameter is simply the distance between entry price and desired trigger price (exit point). For long trade it is entry price minus stop level, while for short trade it is trigger (exit) price minus entry price. Additionally we may check if calculated distance is at least 1-tick large. We can distinguish between long and short entry by checking if one of entry signals is present (if a Buy signal is active then it is long entry, otherwise short). We only need to take care about the fact that if we are using trade delays we need to get delayed Buy signal as shown in the code below:

TradeDelay 1// set it to 0 for no delays

SetTradeDelaysTradeDelayTradeDelayTradeDelayTradeDelay );
TickSize 0.01;

// sample entry rules
Buy CrossMACD(), Signal() );
Short CrossSignal(), MACD() );
Sell Cover 0// no other exit conditions, just stops

BuyPrice SellPrice ShortPrice CoverPrice Close;

// define stop level
stopLevelLong RefL, -); // use previous bar low
stopLevelShort RefH, -); // use previous bar high

// calculate stop amount
stopAmountLong BuyPrice stopLevelLong;
stopAmountShort stopLevelShort ShortPrice;

// make sure stop-amount is at least one tick
stopAmountLong MaxTickSizeBuyPrice stopLevelLong );
stopAmountShort MaxTickSizestopLevelShort ShortPrice );

// assign stop amount conditionally by checking if there is a Buy signal on given bar
IsLong RefBuy, -TradeDelay );
stopAmount IIfIsLongstopAmountLongstopAmountShort );
ApplyStopstopTypeLossstopModePointstopAmountTrue )

Per-symbol profit/loss in a portfolio backtest

Backtesting engine in AmiBroker allows to add custom metrics to the report, both in the summary report and in the trade list. This is possible with Custom Backtester Interface, which allows to modify the execution of portfolio-level phase of the test and (among many other features) adjust report generation.

The example presented below shows how to retrieve individual profit/loss figures for each traded symbol in a portfolio test and add the results as custom metrics to the report. The code performs backtest, then iterates through the list of trades and stores each symbol profit in separate variables. Variables are created with VarSet function, which allows to build variable names dynamically, based on the symbol name. There are 2 variables generated per symbol, one holding profit for long trades and one for short trades. In the last part the code reads the created variables and adds input into the backtest report.

function ProcessTradetrade )
{
  global 
tradedSymbols;
  
symbol trade.Symbol;
  
//
  
if( ! StrFindtradedSymbols"," symbol "," ) )
  {
    
tradedSymbols += symbol ",";
  }
  
//
  // HINT: you may replace it with GetPercentProfit if you wish
  
profit trade.GetProfit();
  
//
  
if( trade.IsLong() )
  {
      
varname "long_" symbol;
      
VarSetvarnameNzVarGetvarname ) ) + profit );
  }
  else
  {
      
varname "short_" symbol;
      
VarSetvarnameNzVarGetvarname ) ) + profit );
  }
}
//
SetCustomBacktestProc"" );
//
/* Now custom-backtest procedure follows */
//
if ( Status"action" ) == actionPortfolio )
{
    
bo GetBacktesterObject();
    
//
    
bo.Backtest(); // run default backtest procedure
    //
    
tradedSymbols ",";
    
//
    //iterate through closed trades
    
for ( trade bo.GetFirstTrade( ); tradetrade bo.GetNextTrade( ) )
    {
        
ProcessTradetrade );
    }
    
//
    //iterate through open positions
    
for ( trade bo.GetFirstOpenPos( ); tradetrade bo.GetNextOpenPos( ) )
    {
        
ProcessTradetrade );
    }
    
//
    //iterate through the list of traded symbols and generate custom metrics
    
for ( 1; ( sym StrExtracttradedSymbols) ) != ""i++ )
    {
        
longprofit VarGet"long_" sym );
        
shortprofit VarGet"short_" sym );
        
allprofit Nzlongprofit ) + Nzshortprofit );
        
// metric uses 2 decimal points and
        // 3 (calculate sum) as a "combine method" for walk forward out-of-sample
        
bo.AddCustomMetric"Profit for " symallprofitlongprofitshortprofit2);
    }
}
//
SetOption"MaxOpenPositions"10 );
//
Buy CrossMACD(), Signal() );
Sell CrossSignal(), MACD() );
Short Sell;
Cover Buy;
SetPositionSize10spsPercentOfEquity 

Once we run the Backtest, we will get the following output in the report, showing individual profit/loss figures for each symbol in test.

Per-symbol profit

If you prefer percent profits instead of dollar profits, just replace GetProfit() call with GetPercentProfit().

Position sizing based on risk

One of most popular position sizing techniques is Van Tharp risk-based method. Van Tharp defines risk as the maximum amount that can be lost in a trade. Typically you limit your loses by setting up a maximum loss stop.

The amount risked should not be confused with amount invested. If your stop is 15% away from entry price, in worst case you risk losing 15% of the position size (amount invested), not the entire amount. So risk practically means the amount of maximum loss stop.

Now, imagine that we only allow to lose 1% of entire portfolio equity in single trade. If our stop is placed 15% away, it means that to risk just 1% of entire equity we can put 1/15 part of our available equity into this trade. As we can see desired position size is inversely proportional to stop amount.

Buy CrossCMAC20 ) ); // some trading rules
Sell CrossMAC20 ), );
//
PositionRisk 1// how much (in percent of equity) we risk in single position
TradeRisk 15// trade risk in percent equals to max. loss percentage stop
PctSize 100 PositionRisk TradeRisk;
//
ApplyStopstopTypeLossstopModePercentTradeRiskTrue );
SetPositionSizePctSizespsPercentOfEquity )

Let us see how it works, say we have equity of $60,000, and we only want to risk 1% in single trade ($600). We set our protective stop to 15%. If stock entry price is say $20, we would put our protective stop at $20-15% = $17, so we will risk $3 per share. Given the fact that we want to risk only $600 in that trade, we could buy 200 shares (position risk 200 * $3 = $600). 200 shares @ $20 each gives position value of $4000. $4000 represents 6.667% of $60,000 and this is actual percentage position size we would open. As we can clearly see 6.667% is what we would get if we divide 1 (percent position risk) by 15 (percent loss amount): 1/15 = 6.667%

Instead of setting our stop as fixed percentage, we can use more sophisticated methods. For example we can adjust our maximum loss (so the risk) dynamically, using average true range, so it will get wider if stock is volatile and narrower if stock prices move in a narrow range. Say we want to set our stop to twice the amount of ATR( 20 ) at the entry bar and risk 3% of portfolio equity in a single trade:

Buy CrossCMAC20 ) ); // some trading rules
Sell CrossMAC20 ), );
//
RiskPerShare =  ATR20 );
ApplyStopstopTypeLossstopModePointRiskPerShareTrue );
//
// risk 3% of entire equity on single trade
PositionRisk 3;
//
// position size calculation
PctSize =  PositionRisk BuyPrice RiskPerShare;
SetPositionSizePctSizespsPercentOfEquity )

This time our maximum loss (so the risk per share) is expressed in dollars not in percents. Let us verify the above calculation. Assume that our equity is $90,000, stock price is $18, ATR(20) is $1. Now risk per share (the stop amount) equals 2 * $1 = $2, so our calculated position size (required % of equity) from the above formula would be:

PctSize = 3 * $18 / $2 = 27%

27% of $90,000 means trade size of $24,300, i.e. 1350 shares (@ $18 each). Since we risk $2 on each share, the total risk is $2 * 1350 shares = $2700, which is exactly 3% of our total equity ($90,000 * 3%).

In case of futures, we would need to take into account the fact that our position size depends on Margin Deposit, while the stop size (expressed in dollars) depends on the Point Value, so the position sizing formula would need to be modified.

Buy CrossCMAC20 ) ); // some trading rules
Sell CrossMAC20 ), );
//
RiskPerContract ATR20 );
ApplyStopstopTypeLossstopModePointRiskPerContractTrue );
//
// risk 1% of entire equity on single trade
PositionRisk 1;
PctSize =  PositionRisk MarginDeposit  / ( RiskPerContract PointValue );
SetPositionSizePctSizespsPercentOfEquity )

Let us assume that we are trading a contract with $5000 margin deposit, point value $50, our equity is 1 million and ATR(20) is equal 5 big points. Risk per contract is then 10 big points. Now the above formula would give us:

PctSize = 1% * $5000 / ( 10 * $50 ) = 10%

10% of our 1 million equity is $100K, which allows us to buy 20 contracts (20 * $5000 each). Since our risk is 10 big points and each big point has a value of $50 we are risking 10 * $50 = $500 per contract. We have 20 contracts so entire position represents a risk 20 * $500 = $10,000 which is 1% of our 1 million equity.

How to setup automatic periodic scans & explorations

One of the most powerful features of AmiBroker is the ability of screening even hundreds of symbols in real-time and monitor the occurrence of trading signals, chart patterns and other market conditions we are looking for. This can be done in Analysis module with Scan or Exploration features.

The main difference between Scan and Exploration is that Exploration allows to customize the output shown in Analysis window (this is explained in details in the following tutorial chapter: http://www.amibroker.com/guide/h_exploration.html), while Scan performs search for at least one of Buy, Sell, Short, Cover signals and displays predefined set of columns. Both these features allow for continuous screening of the database in real-time conditions.

The following procedure shows how to configure basic scan formula and generate alerts when conditions coded in the formula are met. We assume that AmiBroker is already configured to receive real-time data from one of realtime data vendors – the list of recommended datasources is available here: http://www.amibroker.com/guide/h_quotes.html

We need to do the following:
– open Formula Editor window with Analysis->Formula Editor command from the menu
– in the editor window enter or paste the code below

// example trading signals defined here
Buy CrossMACD(), Signal() );
Sell CrossSignal(), MACD() );
//
// additional part of the formula which generates audio alerts when condition is detected
AlertIFBuy"SOUND C:\\Windows\\Media\\Ding.wav""Audio alert");
AlertIFSell"SOUND C:\\Windows\\Media\\Ding.wav""Audio alert")

After entering the code use Tools->Send to Analysis as shown below:

Send to Analysis

Then in the Analysis window select Apply To: All Symbols, Range: 1 Recent bar, this defines which symbols are included in the screening and what time-range will be shown in the results list.

Range setting

To enable continuous screening, mark Auto-repeat (AR) Scan/Explore option and enter the repeat interval. The interval can be specified in minutes or seconds (for example entering 10s means 10-seconds, while 5m means 5-minutes). The below example uses 15-second repeat interval:

Auto-repeat setting

NOTE: If that is the very first screening after launching the database and it may require filling the historical quotes, then it is also required to mark Wait for Backfill (applies to data sources, which support this feature, see: http://www.amibroker.com/guide/h_rtsource.html for more details).

Now press Scan button to initiate the screening process:

Scan

The results window will show the hits and generated alerts will also be logged in Alert Output window and the scan will be automatically repeated every 15 seconds in search for new signals.

Scan

More information about generating and configuration formula-based alerts is presented in this tutorial: http://www.amibroker.com/guide/h_alerts.html

How generate backtest statistics from a list of historical trades stored in a file

Apart from testing mechanical rules based on indicator readings, backtester can also be used to generate all statistics based on a list of pre-defined trades, list of our real trades from the past or a list of trades generated from another software.

To achieve that, first we need to create an input information for AmiBroker where it could read the trades from. A convenient way would be to use an input file in text format, which could store information about trades, including the type of transaction (buy or sell), dates and position sizes. A sample input file may look like this:
Symbol,Trade,Date,Price,Shares
AAME,Buy,2000-04-06,2.66,375.94
AAME,Buy,2000-04-10,2.66,378.922
AAPL,Buy,2000-04-27,31.23,32.0862
AAON,Buy,2000-04-06,3.19,313.48
ABAX,Buy,2000-04-26,7.67,132.101
AB,Buy,2000-04-25,20.23,50.0337
A,Buy,2000-04-27,84.66,11.8362
AAME,Buy,2000-05-10,2.6,373.627
ABCB,Buy,2000-05-11,6.08,159.406
A,Buy,2000-05-15,82.27,11.736
AAON,Buy,2000-05-18,3.84,246.242
AB,Buy,2000-05-15,20.84,46.3303
ABAX,Buy,2000-05-18,5.84,161.913
ABCB,Buy,2000-05-15,6.08,158.803
AAME,Buy,2000-05-19,2.6,363.763
AB,Buy,2000-06-05,22.78,43.3501
ABC,Buy,2000-05-18,4.49,210.595

We can read and backtest such input with the formula presented below. It is important to remember that this particular code can work with input files of identical format (columns in identical order, signals specified with exact Buy / Sell words, position sizes specified as shares). Changing the input format would also require to update the formula to match the input.

Path to the file is specified in the very first line (note that double backslashes need to be used).

The formula reads the file line by line, then on a bar with matching date/time it generates a new Buy or Sell signal that is then combined with existing signals (coming from other bars).

file "C:\\TEMP\\trades.csv"// change this to real location of your data file
dt DateTime();
//
// Initialize variables
Buy Sell possize 0;
//
fh fopenfile"r" );
//
if( fh )
 {
     while( ! 
feoffh ) )
     {
         
line fgetsfh );
         
// get the ticker symbol from the file
         
sym StrExtractline);
         
// if ticker matches current symbol
         
if ( Name() == sym )
         {
             
// extract data from line of text
             
trade StrExtractline);
             
trade_datetime StrToDateTimeStrExtractline) );
             
price StrToNumStrExtractline) );
             
shares StrToNumStrExtractline) );
             
//
             
if ( trade == "Buy" )
             {
                 
newbuy dt == trade_datetime;
                 
Buy Buy OR newbuy// combine previous buy signals with new
                 
BuyPrice IIfnewbuypriceBuyPrice );
                 
possize IIfnewbuysharespossize );
             }
             
//
             
if ( trade == "Sell" )
             {
                 
newsell dt == trade_datetime;
                 
Sell Sell OR newsell// combine previous sell signals with new
                 
SellPrice IIfnewsellpriceSellPrice );
             }
         }
     }
     
//
     
fclosefh );
 }
 else
 {
     
Error"ERROR: file can not be open" );
 }
//
SetPositionSizepossizespsShares )

Debugging techniques – Part 1 – Exploration

From time to time people send us their formulas asking what happens in their own code. Or they do not know why given trade is taken or not. These questions are usually caused by the fact that people lack the insight what is happening inside and what values values their variables hold.

The first general-purpose debugging technique is using Exploration.

You need to add several AddColumn statements and run your code as Exploration, so you can actually see the values of all variables. This will reveal whenever you really have values that you expect and would make it easier for you to understand what is happening inside your code.

In simplest form add this code to your system formula:

Filter 1// show all bars
AddColumnBuy"Buy" )

and it will show you if you are getting expected values in Buy array. You can use the same technique to track the content of any variable. Add as many columns as you want. You would be surprised how much insight into your own code you will get.

You can use Exploration to learn how particular function works, for example, if you don’t understand how ValueWhen works, you can display its results this way:

Filter 1// show all bars
//
MAC10 );
cond CrossC);
bi BarIndex();
//
AddColumnC"Close" );
AddColumnm"Mov Avg" );
AddColumncond"Condition");
AddColumnbi"BarIndex" );
AddColumnValueWhencondbi ), "ValueWhen( cond, BarIndex() )" );
AddColumnValueWhencondClose), "ValueWhen( cond, Close )" )

If you run above code you will clearly see how ValueWhen picks the value when condition is true and “holds” it for all other bars (when condition is false).

Debug using Exploration

Once you get this level of insight into your code you will be better equipped to fix any errors.
Exploration is number one choice in getting detailed view on what is happening inside your code.

For more information about Exploration see http://www.amibroker.com/guide/h_exploration.html

Closing trades in delisted symbols

When we perform historical tests on databases that contain delisted symbols – we may encounter a situation, where there are open positions in those tickers remaining till the very end of the backtest, distorting the results (as these open positions will reduce remaining maximum open positions limit for the other symbols).

Here is an easy technique which allows to force closing positions in those symbols on the very last bar traded for given symbol. The code below just adds an additional Sell signal on the last available bar in the database for this symbol:

bi BarIndex();
exitLastBar bi == LastValuebi );
Sell /*your regular sell rules*/ OR exitLastBar

If we are using 1-bar trade delays in our backtesting settings, then the exit signal would need to be triggered one bar in advance (so the delayed signal could still be traded on the last bar) and the code would look like this:

SetTradeDelays(1,1,1,1);
bi BarIndex();
exitLastBar bi == LastValuebi );
Sell /*your regular sell rules*/ OR exitLastBar

There is also a dedicated field in Symbol->Information window which allows to store the delisting date directly in the database. AmiBroker allows to read that field from AFL code using GetFnData() function. If we have this field populated for delisted symbols for our symbols, then the code forcing exits on delisting date would be:

exitLastBar datetime() >= GetFnData("DelistingDate");
Sell /*your regular sell rules*/ OR exitLastBar

What is important, this approach would work also, when Pad and Align to reference symbol feature is used in Analysis window settings.

In order to populate Delisting Date field in the database, we can enter the dates manually through Symbol->Information window or use ASCII importer to import the information from the input text files. More details about ASCII importing can be found at:
http://www.amibroker.com/guide/d_ascii.html

How to identify signal that triggered entry/exit if multiple signals are used

When designing a trading system we often need to quickly identify which of the rules used in the code triggered the particular Buy or Sell signal. Here are some techniques that may be useful in such identification.

For the purpose of this demonstration let us use a sample formula, where the Buy signal may be triggered by one of three independent rules:

Buy1 CrossMACD(), Signal() );
Buy2 CrossCloseMA(Close50) );
Buy3 CrossRSI(), 30 );
//
Buy buy1 OR Buy2 OR Buy3

To determine which of those three rules generates the entry signal, we can either visualize signals in the chart or use Exploration feature of the Analysis window.

In case a custom chart is used, we can do the following:

  1. display the signal in custom chart title
  2. use PlotShapes function to indicate certain buy rule
  3. use PlotText to add pre-defined text labels.

The formula below shows sample implementations of these three techniques. This is actually one of many ways that can be used for coding such custom output:

Buy1 CrossMACD(), Signal() );
Buy2 CrossCloseMA(Close,50) );
Buy3 CrossRSI(), 30 );
//
Buy buy1 OR Buy2 OR Buy3;
//
// Standard price plot
PlotClose"Close"colorBlackstyleCandle);
//
// Custom title definition
BuyReason EncodeColor(colorGreen ) + WriteIf(Buy,"Buy signals: ","")
           + 
WriteIf(buy1"Buy1 """) +WriteIf(buy2"Buy2""")
           + 
WriteIf(buy3"Buy3""");
Title StrFormat"{{NAME}} - {{INTERVAL}} {{DATE}} Close %g ",Close ) +BuyReason;
//
// Plotshapes function calls
PlotShapes(Buy*shapeUpArrowcolorGreen0Low);
PlotShapes(Buy1*shapedigit1colorGreen0Low,-30);
PlotShapes(Buy2*shapedigit2colorGreen0Low,-45);
PlotShapes(Buy3*shapedigit3colorGreen0Low,-60);
//
//
// Custom text labels displayed with PlotText
if( SelectedValue(Buy) )
{
   
SelectedValueBarIndex() );
   
maxy Status("axismaxy");
   
miny Status("axisminy");
   
0.15 * (maxy miny) + miny;
   
text WriteIf(buy1], "\nBuy1 """)
          +  
WriteIf(buy2], "\nBuy2 """)
          +  
WriteIf(buy3], "\nBuy3 """);
   
PlotTexttexti,  ycolorWhitecolorGreen );

The chart below shows how to use signal visualization technique implemented in the formula.

Chart Example 1

The other method is to use the Exploration feature of Analysis window that allows to generate tabular output, where we can display the values of selected variables. The detailed tutorial explaining this feature is available at:
http://www.amibroker.com/guide/h_exploration.html

For the discussed purpose of tracking the signals that triggered entry or exit, we can add the following code to our trading system to show the values of each Buy1, Buy2, Buy3 variables:

Filter Buy;
AddColumnBuy1"Buy1"1colorDefaultIIfBuy1colorGreencolorDefault ) );
AddColumnBuy2"Buy2"1colorDefaultIIfBuy2colorGreencolorDefault ) );
AddColumnBuy3"Buy3"1colorDefaultIIfBuy3colorGreencolorDefault ) )

Exploration Signal tracking

With regard to exit signals they can be visualized in a similar way as shown above, but there is also an additional functionality in the backtester, which allows to indicate the exit condition directly in the trade list. This can be done by assigning values higher than 1 (but not more than 127) to Sell variable.

Sell1 CrossSignal(), MACD() );
sell2 CrossMA(Close50), Close );
Sell Sell1 10 Sell2 20

The above expression will result in assigning value of 10 to Sell variable for the bars where Sell1 is true, 20 for the bars where Sell2 is true and 30 for the bars where both conditions are true.

These values will be indicated in the trade list:

Backtest exit signal tracking

It is worth to mention that values 1 to 9 are reserved for built-in stops and used internally by the backtester, and have special meaning:

  1. normal exit
  2. maximum loss stop
  3. profit target stop
  4. trailing stop
  5. n-bar stop
  6. ruin stop (losing 99.96% of entry value)
  7. reserved
  8. reserved
  9. reserved

Note also that you must not assign value greater than 127 to Sell or Cover variable. If you assign bigger value it will be truncated.

This is further discussed here: http://www.amibroker.com/guide/afl/equity.html

How to backfill all symbols in RT database

Various data sources have different backfill capabilities, therefore the procedure to backfill all symbols varies. There are three categories of data sources, those that offer:

  1. unlimited backfills (eSignal, IQFeed),
  2. limited, 1-symbol at a time backfill (Interactive Brokers),
  3. no backfill at all (for example DDE)

As a general rule, all real-time data sources provide backfills on-demand, which means that backfill for each symbol has to be requested separately. If data source provides backfill and there are missing quotes in the database, AmiBroker will automatically request backfill on first access to given symbol. So, as soon as you display its chart fresh data will be requested and backfilled. Backfill is not immediate, because it is Internet-based process that involves request-response procedure, so data are requested from external server and arrive in a few seconds or so.
The same procedure is performed when doing any access including running Analysis, so backfill is requested as soon as given symbol is accessed, but by default Analysis window will not wait until backfill data arrive unless you turn on the Wait for backfill option (provided that data source supports it).

Wait for backfill option

It is worth to note that not all data sources support this feature. It needs to be handled by the data plugin, and many 3rd party plugins do not offer this.

If you are using eSignal or IQFeed or other data source with automatic, unlimited backfill you can use procedure described in How to use Real-Time data sources tutorial.

If you are using Interactive Brokers then the procedure is differnet since Interactive Brokers puts lots of limitations on backfills. To learn how to backfill all symbols using Interactive Brokers please read this dedicated tutorial on IB.

If you are using data source that does not offer any backfill, the only option is to use ASCII import to import the historical data from text files.

Broad market timing in system formulas

Some trading systems may benefit from attempt to time the broad market. A market-wide valuation, such as moving average, sentiment or some other mechanism may be used to tell if we should be in the market or not.

Flexibility of AFL language allows to create rules or indicators, which are based on more than just one symbol. This enables us to introduce additional filters based on wide-market index performance.

For the purpose of reading quotes of another symbol one can use Foreign or SetForeign functions.

The following formula shows how to generate entry signals in individual stocks when S&P500 index is above its 200-period moving average and exit signals when S&P500 is equal or below 200-period average (^GSPC is a ticker for Yahoo Finance data for S&P500)

//
// read S&P 500 values from ^GSPC ticker
//
sp500 Foreign"^GSPC""C" );
//
// market-wide filter should be in "state" form
// (so it is True all the time when market is up)
//
marketup sp500 MAsp500200 );
marketdown NOT marketup;
//
// sample trading rules (MACD crossovers)
//
BuySignal CrossMACD(), Signal() );
SellSignal CrossSignal(), MACD() );
//
// combine per-symbo signals with broad-market timing
//
Buy BuySignal AND marketup// enter trade only when buy signal AND market is in up trend
Sell SellSignal OR marketdown// exit position if sell signal OR market turns dow

A more complex broad-market timing that requires not only closing price of market index can be implemented using SetForeign function. SetForeign replaces all OHLCV data series with that of the “other” security and allows to calculate all kind of indicators that would normally use current security. Broad market timing does not need to be just “all-in” or “all-out” switch. For example one can switch the trading method depending on whenever broad market is trending or sideways.

//
// Switch to S&P symbol to calculate broad-market timing
//
SetForeign"^GSPC" );
//
// now we can calculate any indicator based on SP500
//
MarketIsTrending ADX40 ) > 20// ADX (40 days) from SP500
//
// now go back to original data (current symbol)
//
RestorePriceArrays();
//
// you can have different rules that are switched
// depending on what broad market is doing
//
TrendingBuy CrossCMAC30 ) );
TrendingSell CrossMAC30 ), );
//
SidewaysBuy CrossMACD(), Signal() );
SidewaysSell CrossSignal(), MACD() );
//
// switch methods using broad-market timing
//
Buy IIfMarketIsTrendingTrendingBuySidewaysBuy );
Sell IIfMarketIsTrendingTrendingSellSidewaysSell )

In this simple example we assume that market timing signals change very infrequently so they change much less often than Trending/Sideways Buy/Sell signals are generated. If that is not the case the switching logic would need to be more complex to decide what to do when we are in the “trending” trade and market switches to sideways mode. In such situation, the code above uses SidewaysSell signal to sell the position, which may or may not be what you are after.

Another example is changing position sizing depending on broad market conditions. We can choose to be fully invested when broead market is up and only 30% invested in down market.

//
// Switch to S&P symbol to calculate broad-market timing
//
SetForeign"^GSPC" );
//
// now we can calculate any indicator based on
// SP500
//
MarketIsUp MAC200 ); // here C represents closing price of SP500
//
// now go back to origiginal data (current symbol)
//
RestorePriceArrays();
//
// normal rules (in this example they do not chang)
//
Buy CrossMACD(), Signal() );
Sell CrossSignal(), MACD() );
//
// no more than 10 positions open at a time
//
SetOption("MaxOpenPositions"10 );
//
// change position sizing depending on broad market conditions
// in this example we will allocate:
// 10% per position
// if broad market is up (so we can be allocated upto 100% of funds)
// 3% per position
// if broad market is down (so we can be allocated upto 30% of funds)
//
SetPositionSizeIIfMarketIsUp10), spsPercentOfEquity )
« Previous PageNext Page »