amibroker

HomeKnowledge Base

Low-level gfx example: Yearly/monthly profit chart

The code below is an little bit more complex example of Low Level Graphics functions (see http://www.amibroker.com/guide/a_lowlevelgfx.html)

It allows to display three kinds of charts:

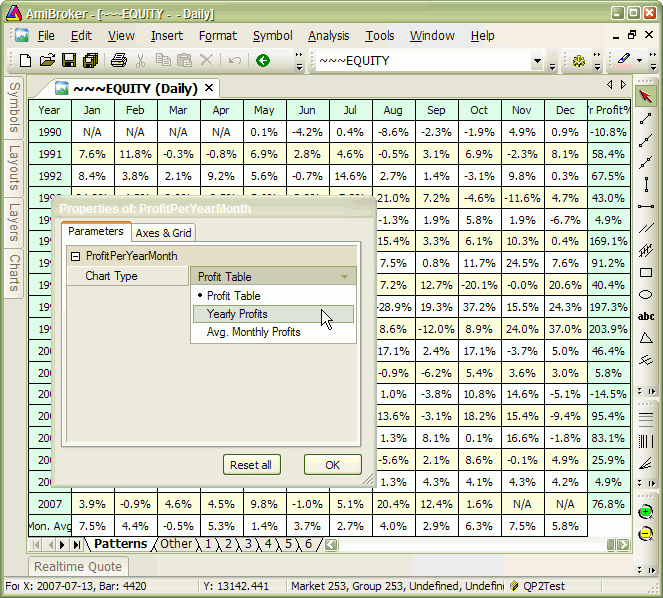
  1. yearly/monthly profit table
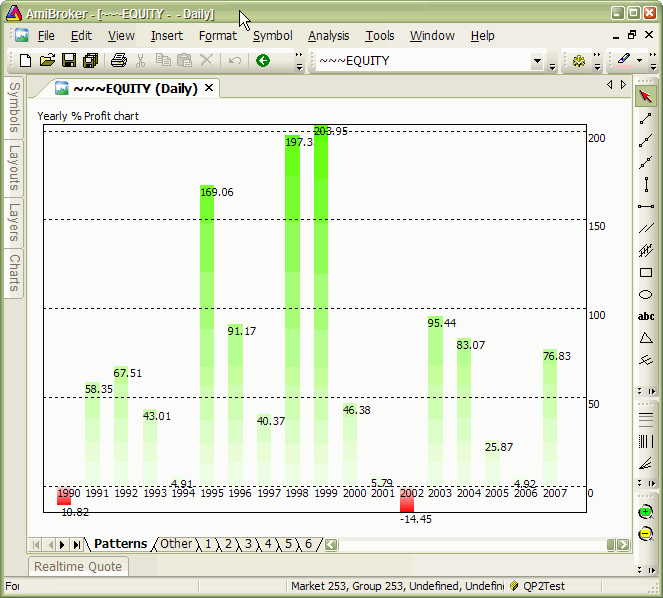
  2. yearly profit bar chart
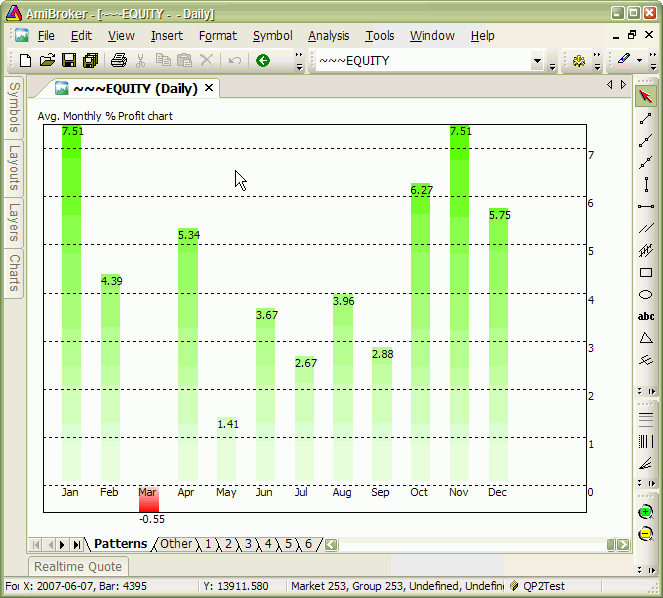
  3. average monthly profit bar chart

The type of chart is switchable from Parameters dialog.

It should be applied to ~~~EQUITY – portfolio equity symbol (so it only produces output if you run backtest before using it).


SetBarsRequired(1000000,1000000);
eq Foreign("~~~EQUITY""C" );

yr Year();
mo Month();

YearChange yr != Refyr, -);
MonChange mo != Refmo, -);

FirstYr 0;
LastYr 0;

startbar 0;

////////////////////////////
// SKIP non-trading bars
////////////////////////////
for( 0BarCounti++ )
{
  if( 
eq] )
  {
    
startbar i;
    break;
  } 
}

////////////////////////////
// collect yearly / monthly changes in equity
// into dynamic variables
////////////////////////////

LastYrValue eqstartbar  ];
LastMoValue eqstartbar  ];

MaxYrProfit MinYrProfit 0;
MaxMoProfit MinMoProfit 0;

for( 
startbar 1BarCounti++ )
{
  if( 
YearChange] || == BarCount )
  {
    
Chg 100 * ( -eq] / LastYrValue );
    
VarSet("ChgYear"yr], Chg );

    
MaxYrProfit MaxMaxYrProfitChg );
    
MinYrProfit MinMinYrProfitChg );

    if( 
FirstYr == FirstYr yr];
    
LastYr yr];

    
LastYrValue eq];
  }

  if( 
MonChange ] || == BarCount )
  {
    
mon mo];

    
Chg 100 * ( -eq] / LastMoValue );

    
VarSet("ChgMon" yr] + "-" monChg );
    
VarSet("SumChgMon"monChg NzVarGet("SumChgMon"mon ) ) );
    
VarSet("SumMon" monNzVarGet("SumMon"mon ) ) );
 
    
MaxMoProfit MaxMaxMoProfitChg );
    
MinMoProfit MinMinMoProfitChg );

    
LastMoValue eq];
  }
}

/////////////////////////////////////////////////
// Drawing code & helper functions
////////////////////////////////////////////////

GfxSetOverlayMode);

CellHeight = (Status("pxheight")-1)/(LastYr FirstYr ); 
CellWidth = (Status("pxwidth")-1)/14
GfxSelectFont"Tahoma"8.5 ); 

GfxSetBkMode);

function 
PrintInCellstringrowCol 
{
 
Color =  ColorRGBIIfrow == || col == || col == 13220255 ), 255IIfrow 2255220 ) );
 
GfxSelectSolidBrushColor   );
 
GfxRectangleCol CellWidth
                    
row CellHeight, (Col ) * CellWidth 1
                    (
row ) * CellHeight  1); 
 
GfxDrawTextstringCol CellWidth 1
                    
row CellHeight 1
                    (
Col ) * CellWidth, (row ) * CellHeight32+); 


YOffset 25;
XOffset 15;

function 
DrawBartextbarnumbarsyMinyMaxy )
{
 
BarWidth = (Status("pxwidth") - XOffset )/( numbars ); 
 
BarHeight Status("pxheight") - YOffset;
 
relpos = ( Miny ) / (Maxy Miny );

 
xp XOffset + ( bar 0.5 ) * BarWidth;
 
yp YOffset BarHeight * ( relpos );
 
xe XOffset + ( bar ) * BarWidth;
 
ye YOffset BarHeight * ( - ( -miny )/( maxy miny ) );
  
 if( 
)
 {
 
GfxGradientRectxpyp,
                  
xe ye,
                  
ColorHSB70255 relpos255 ), ColorHSB7020255 ) );
 }
 else
 {
 
GfxGradientRectxpye,
                  
xe yp,
                  
ColorHSB020255 ), ColorHSB0255 * ( relpos ), 255 ) );
 }
 
GfxTextOuttextxpye );
 
GfxTextOutStrFormat("%.2f"), xpyp );
}    

function 
DrawLevelsMinyMaxy )
{
  
range Maxy Miny;

  
grid 100;
  if( 
range 10 grid 1;
  else 
  if( 
range 20 grid 2;
  else 
  if( 
range 50 grid 5;
  else 
  if( 
range 100 grid 10;
  else 
  if( 
range 200 grid 20;
  else 
  if( 
range 500 grid 50;

  
_TRACE("grid = "+grid +" range "+range );
  
  
width Status("pxwidth") - XOffset;
  
height Status("pxheight") - YOffset;

  
GfxSelectPencolorBlack1);
  for( 
grid ceilMiny grid ); <= grid floorMaxy grid ); += grid )
  {
    
yp =  YOffset Height * ( -  ( Miny ) / (Maxy Miny ) );

    
GfxMoveToXOffsetyp );
    
GfxLineToXOffset width yp );
    
GfxTextOut""yXOffset widthyp );
  }

  
GfxSelectPencolorBlack1);
  
GfxMoveToXOffsetYOffset );
  
GfxLineToXOffset widthYOffset );
  
GfxLineToXOffset widthYOffset Height );
  
GfxLineToXOffset YOffset Height );
  
GfxLineToXOffset YOffset );
}

MonthNames "Jan,Feb,Mar,Apr,May,Jun,Jul,Aug,Sep,Oct,Nov,Dec";

function 
DisplayProfitTable( )
{
 
Header "Year,"+MonthNames+",Yr Profit%";
 for( 
Col 0; (Colname StrExtractHeaderCol ) ) != ""Col++ )
 {
  
PrintInCellColName0Col );
 }

 
Row 1;
 for( 
FirstYr<= LastYry++ )
 {
  
PrintInCellStrFormat("%g"), Row); 
  
PrintInCellStrFormat("%.1f%%"VarGet("ChgYear" ) ), Row13 ); 
  for( 
1<= 12m++ )
  { 
   
Chg VarGet("ChgMon" "-" m);
   if( 
Chg 
     
PrintInCellStrFormat("%.1f%%"Chg ), Row);
   else
     
PrintInCell"N/A"Row);
  }
  
Row++;
 } 

 
PrintInCell("Mon. Avg"Row);
 for( 
1<= 12m++ )
 { 
   
PrintInCellStrFormat("%.1f%%",  NzVarGet("SumChgMon" m)/VarGet("SumMon" ) ) ), Row);
 }

}

function 
DisplayYearlyProfits()
{
 
Bar 0;
 for( 
FirstYr<= LastYry++ )
 {
   
Chg VarGet("ChgYear" );
   
DrawBar""+yBar++, ( LastYr FirstYr ), ChgMinYrProfitMaxYrProfit );
 }
 
GfxTextOut("Yearly % Profit chart"1010 );

 
DrawLevelsMinYrProfitMaxYrProfit ); 
}

function 
DisplayMonthlyProfits()
{
 
Bar 0;
 
 
MinAvgProf MaxAvgProf 0;
 for( 
1<= 12y++ )
 {
   
Chg VarGet("SumChgMon" ) / VarGet("SumMon" );
   
MinAvgProf MinMinAvgProfChg );
   
MaxAvgProf MaxMaxAvgProfChg );
 }

 for( 
1<= 12y++ )
 {
   
Chg VarGet("SumChgMon" ) / VarGet("SumMon" );
   
DrawBarStrExtract(MonthNamesy-), Bar++, 13ChgMinAvgProf MaxAvgProf );
 }
 
GfxTextOut("Avg. Monthly % Profit chart"1010 );

 
DrawLevelsMinAvgProf MaxAvgProf ); 
}

///////////////////////////
// This function checks if currently selected symbol
// is portfolio equity
//////////////////////////
function CheckSymbol()
{
 if( 
Name() != "~~~EQUITY" )
 {
  
GfxSelectFont"Tahoma"20 ); 
  
GfxSetBkMode);
  
GfxTextOut("For accurate results switch to ~~~EQUITY symbol"1010 );
 }
}

////////////////////////////
// Main program - chart type switch
////////////////////////////
type ParamList("Chart Type""Profit Table|Yearly Profits|Avg. Monthly Profits");

switch( 
type )
{
 case 
"Profit Table"
         
DisplayProfitTable();  
         break;
 case 
"Yearly Profits"
         
DisplayYearlyProfits();
         break;
 case 
"Avg. Monthly Profits"
         
DisplayMonthlyProfits();
         break;
}

CheckSymbol()

Figure 1. Profit chart in table mode

Profit chart example 2

Figure 2. Profit chart in yearly mode

Profit chart example 3

Figure 3. Profit chart in monthly mode

Profit chart example 4

How to detect the study crossover for multiple symbols with use of SCAN

It’s possible to use Automatic Analysis window to search for trendline (or other study) crossovers for multiple symbols at once. It’s necessary to do the following:

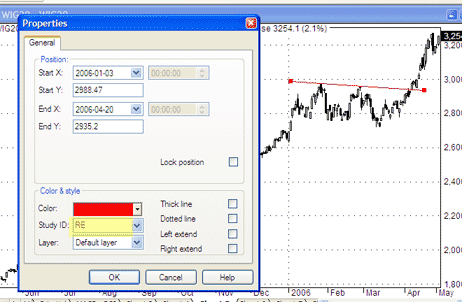
1. Draw trendlines on the chart and assidn them a STUDY ID – two letter code that allows to recognise the particular study. To do this, go to study properties (Alt+Enter) after you draw the line (in this example – StudyID = “RE”).

study1.gif

2. Repeat the process for other symbols (remember to draw the trendlines in the same chart pane).

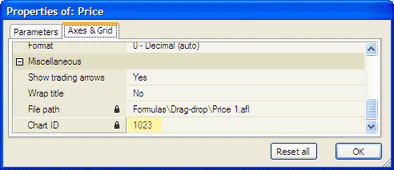
3. Check the CHART ID (in order to call this particular chart pane from the SCAN). To check the ChartID – click on the chart with right mouse button, go to: PARAMETERS -> Axes&Grid (in this example – CHARTID = 1023).

study2.gif

4. Now we can write the formula:
– Analysis -> Formula Editor
– enter:

Buy = Cross( Close, Study(“RE”, 1023) );

(note that we use the same StudyID and ChartID in the formula)
– Tools -> Send to analysis.
– Apply To: All Symbols, All Quotations
– press SCAN

How to close open positions at the end of the day (for daytraders)

If we are backtesting the intraday strategy and we do not want to keep open positions overnight – then it’s necessary to force closing all the open positions before the session end. In order to code it in AFL – the easiest is to use TimeNum() function for that purpose. (more…)

How to set individual trading rules for symbols in the same backtest

The following code shows how to use separate trading rules for several symbols included in the same backtest. (more…)

Stops priority in the default backtest procedure in AmiBroker

The order stops are triggered in the backtest is the following:
 – Fixed Ruin stop (loosing 99.96% of the starting capital)
 – Max. loss stop
 – Profit target stop
 – Trailing stop
 – N-bar stop* (see below)

In versions 4.61 and higher: you can decide if N-BAR stop has the lowest or the highest priority. (more…)

How to display arrows for trades generated in backtest?

In order to display trade arrows, first of all – it’s necessary to enable the arrows for particular chart. To do so – right-click on the chart pane of your choice, choose: Parameters -> Axes&Grid, then set: Show trading arrows to YES, as shown in the screenshot. (more…)

Using redundant signals for entries

NOTE: THIS ARTICLE IS NOW OUTDATED AS AMIBROKER SUPPORTS NEW BACKTEST MODE THAT HANDLES THIS NATIVELY http://www.amibroker.com/f?setbacktestmode

The sample code below shows how to use custom portfolio backtester procedure to change the way backtester works. Normally buy is matched against sell and redundant buy signals between initial buy and matching sell are removed as shown in the picture there:
http://www.amibroker.com/gifs/bt_regular.gif

The procedure below changes this behaviour and allows to use redundant signals (they are not removed).

This is done by changing Buy array values from “true” to sigScaleIn (this prevents redundant signals from being removed because scale-in marks are kept untouched) and modifying standard procedure to treat scale-in signals as normal buys (no scaling).

Note that there are many ways to achieve the same effect. The technique presented here was choosen because it is easy-to-use (does not require changes in your core trading system code – all it needs is to plug-in the custom backtest part). Longer implementation would be required if you do not want to (ab)use scaling signals.

One thing worth mentioning is the fact that since scaling-in signals do not store position score this example formula does not support ranking of signals according to user-defined scores.

// YOUR TRADING SYSTEM HERE 

Buy== HHVH10 ); // REPLACE THIS WITH YOUR OWN BUY RULE
Sell == LLVL10 ); // REPLACE THIS WITH YOUR OWN SELL RULE

PositionSize = -20;
SetOption("MaxOpenPositions"); 

// END OF TRADING SYSTEM HERE 

// COMMON CODE PART
// TO BE COPY-PASTED if you want keep redundant signals
// This is long-only version.
// It is easy to extend to handle short trades as well 

Buy IIfBuysigScaleInFalse ); // replace regular buy signals by scale in
// so they do not get filtered 

SetOption("UseCustomBacktestProc"True ); 

if( 
Status("action") == actionPortfolio )
{
   
bo GetBacktesterObject(); 

   
bo.PreProcess(); // Initialize backtester 

   
for(bar=0bar<BarCountbar++) 
   { 
        for ( 
sig=bo.GetFirstSignal(bar); sigsig=bo.GetNextSignal(bar) ) 
        {     
           
// first handle exit signals 
           
if (sig.IsExit() AND sig.Price != -
           { 
            
// Exit Signal 
               
bo.ExitTrade(bar,sig.symbol,sig.Price); 
           } 
        } 


// update stats after closing trades 
        
bo.UpdateStats(bar); 
       
        
bContinue True
        for ( 
sig=bo.GetFirstSignal(bar); sig AND bContinue
              
sig=bo.GetNextSignal(bar)) 
        { 
          
         
// enter new trade when scale-in signal is found 
         // and we don't have already open position for given symbol 

          
if (sig.IsScale() AND sig.Price != -AND 
              
IsNullbo.FindOpenPossig.Symbol ) ) ) 
          { 
           
// Entry Signal 
            
if( bo.EnterTrade(barsig.symbolsig.IsLong(), 
                
sig.Price,sig.PosSize) == 
           { 
             
// if certain trade can not be entered due to insufficient funds 
             // or too small value (less than "MinPositionValue") or 
             // to few shares (less than "MinShares" 
             // then do NOT process any further signals 
             
bContinue False
           } 
      } 
    } 

     
bo.UpdateStats(bar,1); // MAE/MFE is updated when timeinbar is set to 1. 
     
bo.UpdateStats(bar,2);   
   } 
   
bo.PostProcess(); // Finalize backtester 
   

Adding custom metric: Average adverse excursion

Here is a sample that shows how to create custom metric based on per-trade statisitics.
In this example we will calculate the average value of MAE (maximum adverse excursion) from all trades.
(more…)

How to create copy of portfolio equity?

As you know Portfolio backtester creates special ticker “~~~EQUITY” which holds portfolio-level equity of the system under test. Some may find it useful to save this equity into another symbol after backtest for future analysis and/or comparison. Good news is that it is possible to do that automatically using custom backtester procedure and AddToComposite function. The formula below shows how.
(more…)

Re-balancing open positions

Here is an example that shows how to code rotational trading system with rebalancing. The system buys and shorts top 20 securities according to absolute value of positionscore (user definable – in this example we used 20 day rate-of-change) – each at 5% of equity then each day it rebalances existing positions to 5% if only the difference between current position value and “ideal” value is greater than 0.5% and bigger than one share.

Note that this code sample uses Custom Backtester interface that is documented here.

EnableRotationalTrading(); 

EachPosPercent 5

PositionScore ROCC20 ); 

PositionSize = -EachPosPercent

SetOption("WorstRankHeld"40 );
SetOption("MaxOpenPositions"20 ); 

SetOption("UseCustomBacktestProc"True ); 

if( 
Status("action") == actionPortfolio )
{
  
bo GetBacktesterObject();

  
bo.PreProcess(); // Initialize backtester

  
for(bar=0bar BarCountbar++)
  {
   
bo.ProcessTradeSignalsbar );
  
   
CurEquity bo.Equity;
  
   for( 
pos bo.GetFirstOpenPos(); pospos bo.GetNextOpenPos() )
   {
    
posval pos.GetPositionValue();
   
    
diff posval 0.01 EachPosPercent CurEquity;
    
price pos.GetPricebar"C" );
   
    
// rebalance only if difference between desired and
    // current position value is greater than 0.5% of equity
    // and greater than price of single share
    
if( diff != AND
        
absdiff ) > 0.005 CurEquity AND
        
absdiff ) > price )
    {
     
bo.ScaleTradebarpos.Symboldiff 0priceabsdiff ) );
    }
   }
  }
  
bo.PostProcess(); // Finalize backtester
« Previous PageNext Page »