amibroker

HomeKnowledge Base

Using Exclude statement to skip unwanted optimization steps

Sometimes when we optimize our system, we may want to use only a subset of all parameter permutations for our analysis and ignore the others that do not meet our requirements.

For example – if we test a simple trend-following strategy, where we enter long position when short MA crosses above long MA using code such as:

shortPeriods Optimize("Short MA"1011001);
longPeriods Optimize("long MA"5011001);

Buy CrossMACloseshortPeriods), MACloselongPeriods) );
Sell CrossMACloselongPeriods), MACloseshortPeriods) )

Then, shortPeriods parameter value should remain smaller than longPeriods, otherwise the trading rules would work against the main principle of the tested strategy.

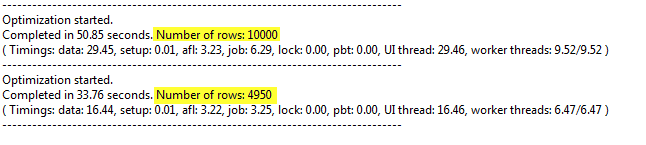
There is an easy way to ignore the unwanted sets of parameters by using Exclude statement in our code. If the variable is true – the backtester will not calculate any statistics for that particular run:

shortPeriods Optimize("Short MA"1011001);
longPeriods Optimize("long MA"5011001);

Buy CrossMACloseshortPeriods), MACloselongPeriods) );
Sell CrossMACloselongPeriods), MACloseshortPeriods) );

Exclude shortPeriods >= longPeriods

The information from Info tab of Analysis window shows the difference between first execution (all 10000 backtest runs) and second one using Exclude statement. Note reduced number of steps and reduced optimization time.

Exclude results

How to add MAE / MFE dates to the backtest report

If we want to identify dates, when MAE and MFE levels have been reached during the trade lifetime – we can use the code example presented below.

The formula will process the trades one-by-one, read BarsInTrade property to know how many bars it took since trade entry till exit, then use HHVBars / LLVBars functions to identify how many bars have passed since lowest low or highest high within trade length.

With the information that highest or lowest value was observed N-bars ago – it will shift Date/Time array accordingly – so with use of Lookup() function pointing at the exitbar – we can read the date when HHV/LLV was observed within trade lifetime (BarsInTrade).

SetCustomBacktestProc"" );

function 
processTradetrade )
{
    
dt DateTime();

    
SetForeigntrade.Symbol );

    
llvDate LookupRefdt, - LLVBarsLowtrade.BarsInTrade ) ), trade.ExitDateTime );
    
hhvDate LookupRefdt, - HHVBarsHightrade.BarsInTrade ) ), trade.ExitDateTime );

    if ( 
trade.IsLong() )
    {
        
maeDate llvDate;
        
mfeDate hhvDate;
    }
    else
    {
        
maeDate hhvDate;
        
mfeDate llvDate;
    }

    
RestorePriceArrays();

    
trade.AddCustomMetric"MFE Date"DateTimeToStrmfeDate ) );
    
trade.AddCustomMetric"MAE Date"DateTimeToStrmaeDate ) );
}

if ( 
Status"action" ) == actionPortfolio )
{
    
bo GetBacktesterObject();

    
bo.Backtest); // run default backtest procedure

    
for ( trade bo.GetFirstTrade(); tradetrade bo.GetNextTrade() )
    {
      
processTradetrade );

    }

    for ( 
trade bo.GetFirstOpenPos(); tradetrade bo.GetNextOpenPos() )
    {
      
processTradetrade );
    }

    
bo.ListTrades();
}

Buy CrossMACD(), Signal() );
Sell CrossSignal(), MACD() )

When and how often AFL code is executed?

All analysis in AmiBroker including charting, Analysis window or commentaries is based on underlying AFL code, which is being executed by the program to produce the required output. Therefore – any changes we see in the charts or analysis results (for example – chart updated with new ticks) mean that the program has received some input, then based on this information has recalculated the formula and presented the updated results.

These refreshes / formula recalculations depend on several factors:

  1. In a local database, which is not updated by a realtime plugin, the formula would get refreshed if we perform any actions, such as clicking, scrolling, zooming, changing parameters, choosing another symbol or interval, importing new data etc.
  2. In addition to the actions listed in (1), if we are running a plugin-based realtime feed, then the chart is refreshed based on “Intraday refresh interval” defined in Tools –> Preferences –> Intraday. If we enter 0 into this field, then it will result in chart being refreshed with every new tick (up to 10-times per sec).
  3. It is also possible to force certain refresh rate using dedicated RequestTimedRefresh() function in the AFL code: http://www.amibroker.com/f?RequestTimedRefresh
  4. It is also possible to manually refresh chart (or all chart and windows) using View->Refresh (or View->Refresh All) menu.

It is worth noting that chart formulas are refreshed only when they are placed on the active chart sheets. Non-active sheets just ‘don’t exist’, they are only created when you click on a bottom tab (sheet tab) to make them visible and destroyed immediately when other sheet becomes active. This ensures that precious CPU resources are not wasted on invisible chart sheets.

Additionally – by default charts in minimized chart windows or when multiple MDI windows are open and one is maximized, the windows in background that are completely obscured by others and/or minimized windows are not redrawn/refreshed during normal RT refresh. We can however call RequestTimedRefresh function with onlyvisible argument set to False and that will force regular refreshes in such windows as well.

RequestTimedRefreshFalse ); // force refresh for minimized MDI window or obscured MDI windo

With regards to Analysis window – in general the formula is executed when we run e.g. Scan, Exploration, Backtest etc. Analysis window executes the formulas in multiple threads running in parallel (this tutorial explains multi-threading aspects: http://www.amibroker.com/guide/h_multithreading.html).

Repeated execution (to keep the code running over and over) in Analysis window can be also enabled with “Auto-repeat” option, the following Knowledge Base article explains it in details:

http://www.amibroker.com/kb/2014/10/03/how-to-setup-perodic-scans/

Last but definitely not least, we need to remember that AmiBroker may and will perform some executions internally for its own purposes such as:

  1. during AFL Syntax Check that happens when applying the chart, or sending the code to Analysis window, or updating existing formula
  2. when it is about to display Parameters window for the first time for given chart or during Parameters’ “Reset All” operation
  3. at the beginning of Optimization when it reads Optimize() statements to configure the optimization process and/or smart optimization engines
  4. at the beginning of each In-sample walk-forward step again to setup optimization parameters

Bottom line: we should never assume that certain formula will only be executed e.g. N-times during certain time-frame, because all really depends on the above factors, our actions and changing input.

High-Low of certain hours of the day

When we want to calculate high / low of selected hours of the trading session (e.g. first two trading hours), we can refer to TimeNum() function to identify timestamps of the bars. Then with use of HighestSince and ValueWhen functions we can obtain the high/low readings we need.

tn TimeNum();

// define start/end hours in TimeNum format
StartTime 93000;
Endtime 113000;

// these conditions are true when TimeNum of the bar equals startime/endtime
StartBar tn == StartTime;
EndBar tn == Endtime;

// on the end bar we read the value of highest high or lowest low since the start bar
myH ValueWhenEndBarHighestSinceStartBarHigh ) );
myL ValueWhenEndBarLowestSinceStartBarLow ) );

// display price and high / low arrays
PlotClose"Close"colorDefaultstyleBar|styleThick );
PlotmyH"myH"colorGreenstyleThick );
PlotmyL"myL"colorRedstyleThick );

// grey lines show how highest high / lowest low develop since start bar
PlotHighestSinceStartBarHigh ), ""colorgrey50 );
PlotLowestSinceStartBarLow ), ""colorgrey50 );

// area chart shows the zone we are reading our values from
Plottn >= StartTime AND tn <= Endtime""
      
ColorBlendcolorYellowcolorWhite0.9 ), 
      
styleArea styleOwnScale010, -1)

H-L from selected hours

Now we can use myH and myL arrays in strategies that e.g. check for breakouts from the first two hours of trading session etc.

It is important to remember that the code checks for equality, so the timestamps used in our charts must exactly match the time we specify in the code. The timestamp settings can be defined in Tools->Preferences->Intraday. The approach presented above uses 1-minute data and timestamps showing Start Time of Interval

How to use custom backtest metric as an optimization target

In Optimization and Walk Forward testing AmiBroker allows us to choose the optimization target that determines optimum values of optimized parameters. This can be done in Analysis->Settings->Walk Forward tab and the drop down list contains a list of built-in statistics to choose from:

Walk forward settings

However, we are not limited to built-in metrics only. Custom Backtester Interface allows us to add any custom statistics to the backtest/optimization reports and we can use these metrics for optimization too.

To do that, we first need to add a custom metric (this article explains how to do it: http://www.amibroker.com/guide/a_custommetrics.html). Then – we need to type-in our metric name into the Optimization Target box:

Walk forward settings - custom metric

The name we enter must be an exact match of the metric name we have defined in AddCustomMetric() method. If entered name can not be found in the Optimization result table, then Net Profit will be used instead.

Importing auxilliary data into AmiBroker database

AmiBroker database structure offers the following fields: Open, High, Low, Close, Volume, OpenInt, Aux1, Aux2. The last two fields, i.e. Aux1 and Aux2 are meant for storing any custom historical data-arrays we may need.

Pretty often, we already have quotations data present in the database and we just want to put some extra data into auxiliary fields. To combine existing data with imported data, we can need to use hybrid mode. In the Import Wizard just add this command in “Additional commands’ field.

# This example assumes that file has format: 
# Symbol, Year-Month-Day, auxiliary_data1, auxiliary_data2
$FORMAT Name, Date_YMD, Aux1, Aux2
$HYBRID 1
$ALLOWNEG 1

Hybrid mode works so that with each imported record it looks for matching record in the database and it combines existing data with data being imported. If OHLC prices are not provided in the imported file you need to specify $ALLOWNEG 1 option. Otherwise you would get error messages about missing close price.

Auxiliary data fields can then be read using simply Aux1 and Aux2 identifiers:

PlotAux1"Aux1"colorRed )

However – if two additional fields are not enough for our purposes, we can also import quotes into some synthetic tickers and have another set of OHLC, V, OI, Aux1 and Aux2 fields available for importing. Synthetic ticker in this context means just a custom symbol name that’s used just for storing such extra data. So – instead of importing additional arrays into IBM ticker or AAPL ticker, we could use for example IBM_extra and AAPL_extra symbols and their fields.

Using such common naming pattern (i.e. identical ‘_extra’ suffix with the original ticker name) will be useful, because later on to access data from the selected field we could use just the following AFL call:

myVal ForeignName() +"_extra""C")

and this line will read value from Close field of the respective ‘extra’ ticker as we select IBM or AAPL.

An alternative way to store and handle several custom arrays would be to use SQL database, then we could use ODBC plugin to read such data. The documentation of ODBC plugin is available at:

http://www.amibroker.com/odbc.html

Why Analysis results and Chart output may differ

In general AFL functions return identical results when the input data and settings are the same, no matter if they are called from the chart formula or from Analysis window.

Therefore, when we observe differences in results obtained in the chart vs results in Analysis window out of the same code, we should check the following settings to make sure we indeed provide identical input to our formula.

First thing to check is the data interval used in the chart and in Analysis window – it needs to be identical

Chart:
Chart periodicity

Analysis:
Analysis periodicity

Second thing to check, is that if we use Param() function in the code – we need to remember that parameters are separate for Analysis window (Analysis module has ChartID equal to 0). Therefore – it is necessary to keep the parameter settings in sync:

Parameters in Analysis window

Third thing to check is the Pad and align data to reference symbol option that may affect input data for Analysis window calculations if there are differences in quotes or timestamps between the analysed ticker and the reference symbol, so unchecking this option may be required:

Pad And Align in Analysis window

Last thing, is that if we calculate our indicators recursively in loops or use functions such as Cum() where results may depend on the number of loaded bars, then we also need to verify if e.g. chart zoom range makes any difference for our results in the chart.

AmiBroker uses its QuickAFL feature to optimize loaded data-range for best performance, however if our code is sensitive to a number of loaded bars, we may need to e.g. force loading certain number of historical bars with SetBarsRequired() function.

More information about QuickAFL can be found in the following KB article:
http://www.amibroker.com/kb/2008/07/03/quickafl/

Detecting N-th occurrence of a condition using modulus operator

Modulus (%) is an operator that returns the reminder from integer division. It is very helpful to create counters that wrap-around at user-specified N.

In order to define a condition, which returns True every Nth bar, the easiest way is just to use % (modulus) operator. If we apply modulus to consecutive numbers such as BarIndex() – then calculating the reminder from integer division of barindex by N will return 0 every Nth bar (on bars that are divisible by N). We can use the following exploration to demonstrate that:

7;
bi BarIndex();
condition bi == 0;

Filter 1;
AddColumnbi"BarIndex");
AddColumnbi "Div by 7 remainder ");
AddColumnIIFcondition'T''F' ), "Condition",
           
formatCharcolorDefaultIIfconditioncolorYellowcolorDefault ) )

Modulus 1

Since the remainder from division by 7 will equal zero only for the multiples of 7, then we will have our condition True every 7th bar (as marked in the above exploration results with T letter on yellow background).

Using the same technique we can also count occurrences of certain criteria and then apply the % operator. For example – let us say we want to test a rotational strategy, where we rotate our portfolio every 2nd Monday. To detect such condition in our code we need to first identify all Monday bars, then count them and use % operator to divide such count by 2.

The following exploration shows the calculations of the condition we look for:

Filter 1;
AddColumnDayOfWeek(), "Day of week");
AddColumnMon"Monday");
AddColumncountMon"Monday counter");
AddColumncountMon == 0"division by 2 remainder");
AddColumnrotation"condition"1colorDefaultIIfrotationcolorYellowcolorDefault) )

Modulus 2

Here is the formula showing how to code these technique for the rotational back-test:

SetBacktestModebacktestRotational );
posScore 100 RSI(); // sample scoring indicator
SetPositionSize10spsShares ); // sample position sizing

Mon DayOfWeek() == 1// identify Mondays
countMon CumMon ); // count Mondays

// rotate only on Monday, every 2nd one
rotation Mon AND (countMon == );
PositionScore IIfrotationposScorescoreNoRotate )

Choosing compression method for Aux1 and Aux2 fields

Apart from regular Open, High, Low, Close, Volume, OpenInt fields – AmiBroker database allows to store custom data in auxiliary fields called Aux1 and Aux2. This allows to import our custom arrays and store in the database.

Since the data stored in those fields will vary, depending on the actual records imported in there – then in case of time-compressed intervals we may need to determine how exactly these values are compressed if we e.g. switch from Daily to Weekly interval. By default these values would get compressed the same way as Close field, i.e. Last value from given period would be used. We can however choose specific compression method if we need these fields to behave differently (for example like Volume, where weekly record represents a Sum of daily volumes).

The compression mode for Aux1 and Aux2 can be defined in File->Database Settings->Intraday Settings dialog Aux1,2 aggregation mode field:

Aux compression mode

How to fix side-by-side configuration error in 64-bit version

When 64-bit version of AmiBroker is installed, the setup program checks in the system registry if required runtime libraries are present, and if not – then it downloads and installs proper runtimes from Microsoft website. However – it may sometimes happen that the information in the system registry indicates that the required runtimes are installed, while in fact they are missing or incomplete. In such situations we may see the following error displayed when launching AmiBroker:

The application has failed to start because its side-by-side configuration is incorrect.
Please see the application event log for more detail.

To fix the problem we need to install Microsoft C++ runtime libraries vcredist_x64.exe manually. Correct x64 VC2005 runtime required by 64-bit version has the version number 8.0.50727.6195

It can be downloaded and installed from:
https://www.microsoft.com/en-us/download/details.aspx?id=26347

More documentation can be found at
https://support.microsoft.com/kb/2538242

NOTE: This article applies only to AmiBroker 64-bit from version 5.60 to 6.11. It does NOT apply to any 32-bit version of AmiBroker.

« Previous PageNext Page »