amibroker

HomeKnowledge Base

How to restore accidentially deleted price chart

When working with chart windows it sometimes may happen that we mistakenly close the chart we meant to keep displayed. Here are some suggestions showing how to quickly restore our working setup.

First situation happens when when we closed all chart windows and AmiBroker shows just an empty application window, what looks like this:

Empty chart space

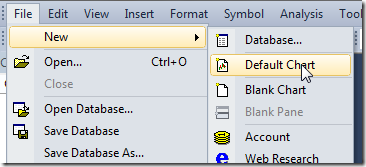
In such situation the best way is to use File–>New–>Default Chart menu command, as a result will display a new chart window, which contains charts stored in default template.

Re-open default chart

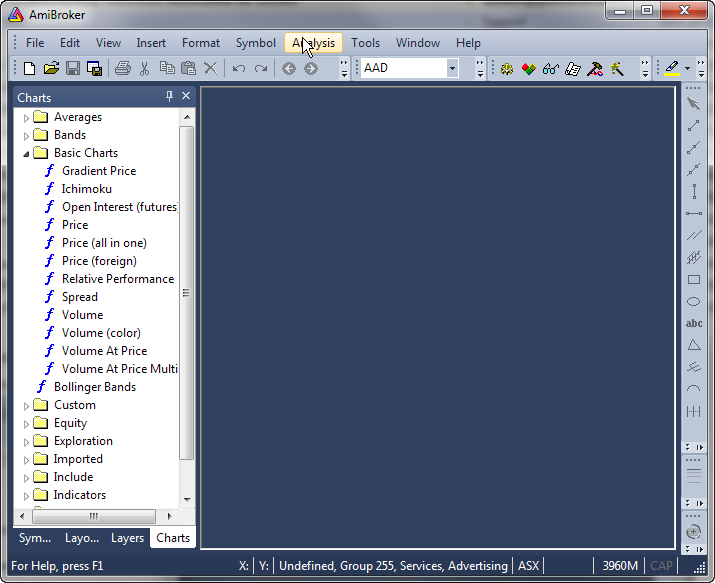
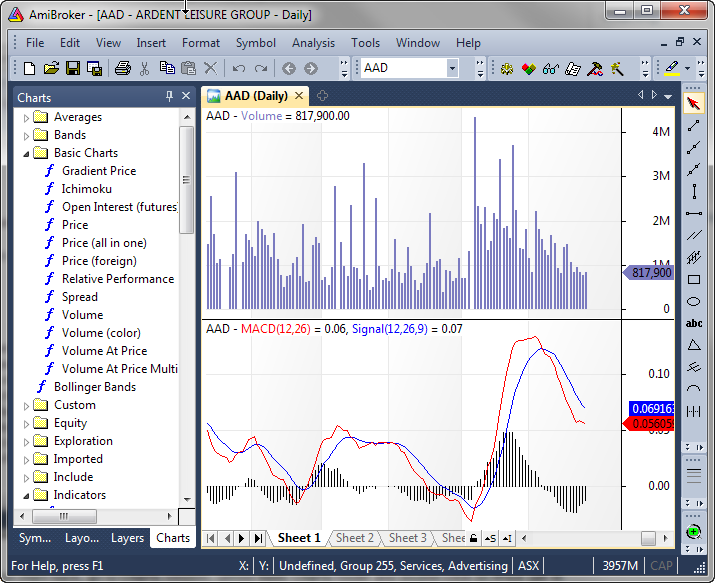
Second situation is when we closed just the Price chart pane, so only indicators would remain in the chart window, looking like this:

No price pane

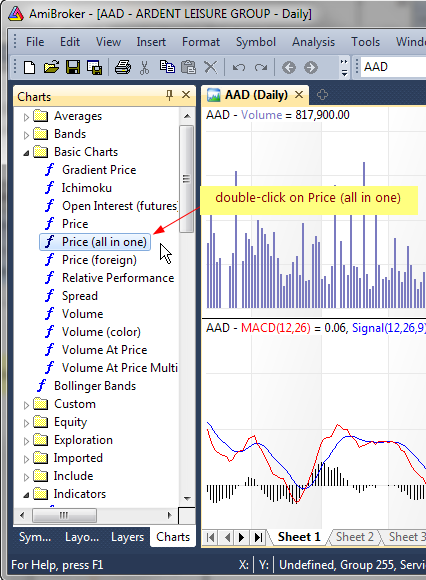
In order to bring the Price chart back, go to Charts window, unfold Basic Charts folder and double-click on Price (all in one) (if you want to get price chart with moving average and Bollinger bands overlays), or double-click Price (if you want to get price chart alone).

Insert price chart

It will be located at the bottom, below the other charts, but we can move it up to the top if we right-click on the chart, then choose Pane->Move Up from the context menu.

It is worth noting that AmiBroker allows to create multiple chart setups stored in Layouts, so if we have already created several layouts before, it is also possible to re-load one of the layouts from the Layouts window to restore the whole saved chart setup. This functionality is discussed in details in the following tutorial chapter: http://www.amibroker.com/guide/h_sheets.html

Why can’t I change the symbol? (Symbol lock)

If you can not change the active symbol for the chart, chances are that you have accidentally clicked “Symbol Lock” icon (a small padlock) located near the scroll bar.

Symbol Lock

When it is activated (yellow) then AmiBroker will prevent any symbol changes for active chart window. To toggle lock simply press the padlock icon.

How to display Range Bars

The Range Bars are price-driven bars, with each bar having a required minimum high-low range. Source data are consolidated into one bar until the range requirement is reached, then a new bar is started.

AmiBroker fully supports range-bar type of charting and the bar size is based on the TickSize of given symbol. This allows to define symbol-specific tick sizes individually, them display a chart which for example shows 10R bars (meaning bars using a range of 10-ticks for each symbol respectively).

To display range charts, first you need to specify the TickSize in the Symbol–>Information window.

Information window

This can be done manually as shown above, however in case of larger group of symbols it is also possible to use ASCII Importer for this purpose (more details about ASCII imports can be found here: http://www.amibroker.com/guide/d_ascii.html).

Once TickSize has been defined, then in order to display chosen range chart, the easiest way is to use Interval box in the toolbar and just type-in the desired bar size. For example, to select the range bar of 10-ticks, one can type-in 10R in the toolbar:

Range bar selection

Custom range intervals can also be defined in Tools–>Preferences, Intraday tab:

Preferences window

Then the pre-defined interval can be selected from View->Intraday menu.

It is worth noting that for best results, your database should use Tick as Base Time Interval, as then each trade is represented by an individual record in the database and can be consistently compressed to range bars. Using higher-interval data (such as 1-minute) may produce bars that are not perfect, especially if 1-minute bar high-low difference is comparable with selected range.

How to display Bond and Bill prices in fractions

Treasury Bond and Bill futures are traded in fractions, not decimals. A typical bond quote may be 124’21 which means 124 and 21/32nds, so one needs special method to display prices in non-decimal format.

To achieve desired result we need to do two things.

1. Switch Y axis grid to desired fraction format. To make a change, right click on the chart and select Parameters, then switch to Axes & Grid tab and change Grid Format as shown below:

Parameter Window

2. Create a price chart with custom title showing fractions instead of decimals. Go to Analysis->Formula Editor, enter the following formula and press Apply Indicator toolbar button.

function NumToFracnum )
{
  return 
StrFormat("%.0f'%0.f"floornum ), fracnum ) * 320 );
}
PlotClose"Close"colorDefaultstyleCandle);
Title "{{NAME}} - {{INTERVAL}} {{DATE}} Close: " NumToFracClose )

The NumToFrac function formats decimal value into full points and 1/320nds fraction of the full point.

Study() function in logarithmic scale

IMPORTANT: This article applies ONLY to AmiBroker version 5.24 and earlier. Version 5.25 includes native support for log scale in Study() function and this workaround is no longer needed.

Some of you may have tried using Study() function in logarithmic scale charts and noticed that the output of Study() function becomes curved line (not straight) as soon as logarithmic scale is used.

Before giving you solution, I would like to state some obvious things:
A straight line in log scale is NOT straight line in linear scale and vice versa. Trendlines drawn in log scale do NOT cross at the same points (except beginning and ending) as same trendline drawn in linear scale. This is pretty much the same in all charting programs.

As for the Study() function – it always uses LINEAR equation y = a*x + b regardless of particular chart scale. So, Study() always produces straight line in the linear price domain, so “a” coefficient is constant and represents the slope in price terms (dollar per bar)

This is done so, because Automatic Analysis does not have a concept of “scale” (linear vs logarithmic), therefore if Study() function was dependent on given pane setting it would not produce the same result, if the same formula was used in automatic analysis.

If you want to have “straight” line in the logarithmic price domain you need to convert to log domain in the formula, as shown in the code below


function StudyInLogScaleStudyidChartid )
{
  if( 
Version() < 5.25 )
  {
   
SetBarsRequiredsbrAllsbrAll );

   
temp StudyStudyidChartid );

   
bi BarIndex();

   
beg LastValueValueWhenExRemtemp), bi ) ); 
   
end LastValueValueWhentempbi ) );

   
result Null;
 
   if( 
beg BarCount AND end BarCount )
   {
    
begval tempbeg ];
    
endval tempend ];
    
factor endval/begval;

    for( 
beg<= endi++ )
    {
      
result] = begval factor ^ ( ( beg )/( end beg ) ); 
    }
   }
  }
  else
  {
    
result StudyStudyidChartid );
  }

  return 
result;        
}

logscale ParamToggle("Log Scale""Off|On");

SetChartOptionsIIflogScale2), chartLogarithmic );

PlotC"Price"colorBlackstyleCandle );

if( 
logscale AND Version() <= 5.24 )
{
 
ss StudyInLogScale("RE"GetChartID() );
}
else
{
 
ss Study("RE"GetChartID() );
}

Plotss"Study"colorRed )

How to convert from bar-value to pixel co-ordinates

NOTE: This article describes old method of using bar/value coordinates. New code should use GfxSetCoordsMode which allows you to use bar/value without any extra calculations.

Sometimes when using low-level graphics functions it is needed to convert from bar number to pixel X co-ordinate and from price level to pixel Y co-ordinate. Converting between them needs knowing visible bar range, Y-axis value range and pixel dimensions of drawing area. Once these params are known it is just a matter of performing simple scale transformation. The code example below shows how to do that.

function GetVisibleBarCount()
{
 
lvb Status("lastvisiblebar");
 
fvb Status("firstvisiblebar"); 

 return 
MinLvb fvbBarCount fvb );


function 
GfxConvertBarToPixelXbar )
{
 
lvb Status("lastvisiblebar");
 
fvb Status("firstvisiblebar");
 
pxchartleft Status("pxchartleft");
 
pxchartwidth Status("pxchartwidth"); 

 return 
pxchartleft bar  pxchartwidth / ( Lvb fvb );


function 
GfxConvertValueToPixelYValue )
{
 
local MinyMaxypxchartbottompxchartheight

 
Miny Status("axisminy");
 
Maxy Status("axismaxy"); 

 
pxchartbottom Status("pxchartbottom");
 
pxchartheight Status("pxchartheight"); 

 return 
pxchartbottom floor0.5 + ( Value Miny ) * pxchartheight/ ( Maxy Miny ) );


Plot(C"Price"colorBlackstyleHistogram ); 

GfxSetOverlayMode(0);
GfxSelectSolidBrushcolorRed );
GfxSelectPencolorRed ); 

AllVisibleBars GetVisibleBarCount();
fvb Status("firstvisiblebar"); 

for( 
0AllVisibleBars i++ ) 

  
GfxConvertBarToPixelX); 
  
GfxConvertValueToPixelYCfvb ] ); 

  
GfxRectanglex-1y-12y+); 


RequestTimedRefresh(1); // ensure 1 sec refres

Note that when chart scale changes, it will usually require one extra refresh to get low-level graphics alignment to new scale. That’s why we added RequestTimedRefresh call at the end.

Big symbol text in the background

Recently I heard the suggestion to add a security symbol written in big letters in the chart background. Well, actually it is pretty simple to do using low-level gfx. Just add this code sniplet anywhere in your chart formula.

GfxSetOverlayMode(1);
GfxSelectFont("Tahoma"Status("pxheight")/);
GfxSetTextAlign);// center alignment
GfxSetTextColorColorRGB200200200 ) );
GfxSetBkMode(1); // transparent
GfxTextOutName(), Status("pxwidth")/2Status("pxheight")/12 )

UPDATE: I have added transparent mode, so it works fine on non-white backgrounds too.

How to display the indicators based on Advances/Declines

IMPORTANT: The article below applies ONLY TO LOCAL DATABASES. If you are using ANY plugin-driven database (eSignal, IQFeed, Premium Data, Norgate, Interactive Brokers or whatever other 3rd party plugin), then you SHOULD NOT use “calculate composites” tool. Instead use composite symbols that are provided by data vendor. Contact data vendor to learn what symbols given data vendor uses, because composite symbols are NOT standarized and vary from vendor to vendor

In order to display indicators based on Advances/Declines first of all it’s necessary to calculate composities in the database:

  1. Open Categories window using Symbol->Categories menu item.
  2. Select base index for given market in Markets tab and Base indexes for – Composites combo.
    For example if you are following NYSE this can by ^DIJ (Dow Jones Average)
    (certain symbol must be marked as index in Symbol -> Information and must belong to the same market)

  3. Choose Symbol ->Calculate composites  menu item to open the window shown below and mark:
    – Number of advancing/declining issues and
    – Apply to: all quotes, All markets

  4. Click Calculate . From now on ADLine, AdvVolume() and TRIN indicators will be visible.

Q: Why does AB need “base index”?
A: Just because it may happen that not all stocks are quoted every businness day and AB needs must calculate number of advancing/declining issues per market. So it checks the “base index” quotations dates and tries to find corresponding quotes of all stocks belonging to that market to find out how many issues advanced, declined and not changed at all.

Q: What are “Volume for base index” and “Copy volume to all indexes” checkboxes for?
A: “Volume for base index” and “Copy volume to all indexes” are provided in case you DON’T have real volume data for index quotes. In that case AmiBroker can calculate volume for index as a sum of volumes of all stocks belonging to given market. First option assigns calculated volume only to “base index”, the second copies the volume figure to all indexes belonging to given market.

How to detect the divergences

There are many different ways to check for divergences. One of the simplest is to use Rate of change indicator and EXPLORATION feature of Automatic Analysis window:

– Analysis -> Formula Editor
– enter:
 
// 5 day rate of change of close
PriceUp ROCC) > ;
// 5 day rate of change of MACD histogram
MacdUP ROCMACD() - Signal(), ) > 0;
BullishDiv NOT PriceUP AND MACDUp;
BearishDiv PriceUP AND NOT MACDUp;
Filter BullishDiv OR BearishDiv;
AddColumnBullishDiv"Bullish Divergence"1.0,
       
colorDefaultIIf(BullishDivcolorGreencolorDefault ) ); 
AddColumn
BearishDiv "Bearish Divergence"1.0,
       
colorDefaultIIf(BearishDiv colorRedcolorDefault) )

– Tools -> Send to Auto-analysis
– Apply to: All Symbols, N last quotations = 1
– press EXPLORE

Tools -> Send to Auto-analysis- Apply to: All Symbols, N last quotations = 1- press EXPLORE

A different approach can use linear regression instead:
 
// 10 day linear regression slope of close
PriceUp LinRegSlopeC10 ) > ;
// 10 day linear regression slope of MACD histogram
MacdUP LinRegSlopeMACD() - Signal(), 10 ); 


How to detect the study crossover for multiple symbols with use of SCAN

It’s possible to use Automatic Analysis window to search for trendline (or other study) crossovers for multiple symbols at once. It’s necessary to do the following:

1. Draw trendlines on the chart and assidn them a STUDY ID – two letter code that allows to recognise the particular study. To do this, go to study properties (Alt+Enter) after you draw the line (in this example – StudyID = “RE”).

study1.gif

2. Repeat the process for other symbols (remember to draw the trendlines in the same chart pane).

3. Check the CHART ID (in order to call this particular chart pane from the SCAN). To check the ChartID – click on the chart with right mouse button, go to: PARAMETERS -> Axes&Grid (in this example – CHARTID = 1023).

study2.gif

4. Now we can write the formula:
– Analysis -> Formula Editor
– enter:

Buy = Cross( Close, Study(“RE”, 1023) );

(note that we use the same StudyID and ChartID in the formula)
– Tools -> Send to analysis.
– Apply To: All Symbols, All Quotations
– press SCAN

« Previous PageNext Page »