November 18, 2014
How to plot daily High and Low on intraday chart
The AFL offers a set of time-frame functions which allow to use multiple intervals within a single formula (the topic is explained in details in the following tutorial chapter: http://www.amibroker.com/guide/h_timeframe.html)
In situations, where we do not need to calculate any indicators based on higher interval data, but rather just read OHLC, V or OI arrays – TimeFrameGetPrice is the most convenient function to use.
To plot daily High and Low levels we just need to read the respective arrays calling: TimeFrameGetPrice(“H”, inDaily ) – the first argument specifies the array we want to read, the second argument defines the interval we are reading data from. As with any other TimeFrame functions – we can only read data from higher intervals, so it is possible to read daily data when we work with 1-minute quotes, but not the other way round.
Here is a sample formula which draws daily high and low in the intraday chart:
Plot( Close, "Close", colorDefault, styleBar );
Plot( TimeFrameGetPrice("H", inDaily ), "day high", colorGreen, styleStaircase | styleThick);
Plot( TimeFrameGetPrice("L", inDaily ), "day low", colorRed, styleStaircase | styleThick)TimeFrameGetPrice() functions allow also to easily shift the reading by N-bars of the higher interval if we specify that in 3rd argument of the function, so calling TimeFrameGetPrice( “H”, inDaily, -1 ) will return the high of previous day.
The following code draws high / low of previous day on top of the intraday chart:
Plot( Close, "Close", colorDefault, styleBar );
hlstyle = styleStaircase | styleThick;
Plot( TimeFrameGetPrice( "H", inDaily, -1 ), "Prev High", colorGreen, hlstyle );
Plot( TimeFrameGetPrice( "L", inDaily, -1 ), "Prev Low", colorRed, hlstyle )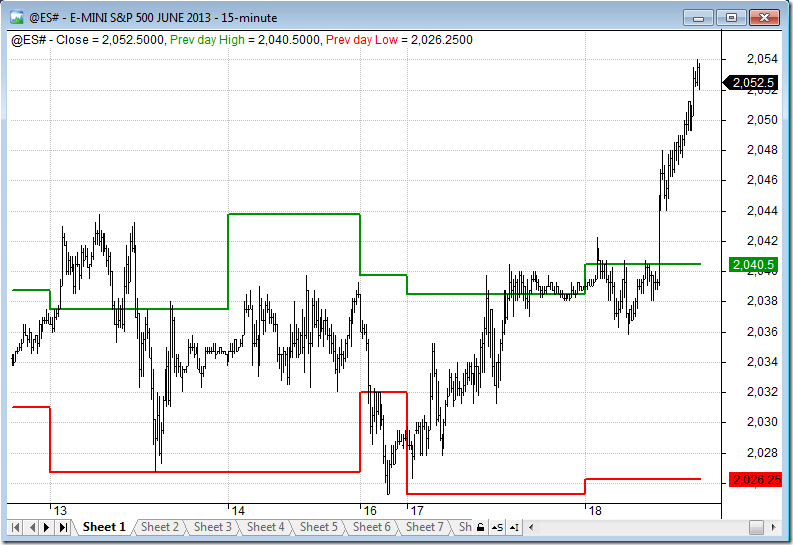
 Filed by Tomasz Janeczko at 4:27 pm under Indicators
Comments Off on How to plot daily High and Low on intraday chart