amibroker

HomeKnowledge Base

Drawing line extensions on future bars using AFL

AmiBroker allows to display the AFL-based chart output on the future blank bars area with use of XSHIFT argument of the Plot function. This functionality allows to move the particular chart by certain number of bars and place the output within the blank bars area (provided that we use positive value for XSHIFT, i.e. we are shifting the chart to the right).

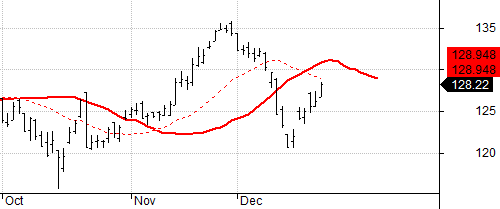
The following code shows price chart with 20-period MA overlay and additionally – with the same 20-period MA shifted to the right.

PlotClose"Close"colorDefaultstyleBar );

PlotMAClose20 ), "MA-20"colorRedstyledashed );
PlotMAClose20 ), "MA-shift"colorRedstyleThickNullNull10)

Chart with XShift

However – there may be some situations where we not only want to shift the chart position, but actually calculate the position of the line on the blank bars, for example if we are producing an extension of the existing indicator line.

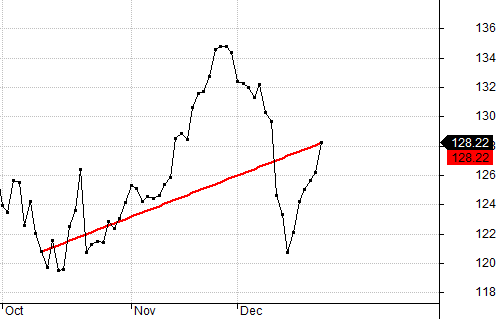
Let us consider a simple example, which draws a line connecting the last record of the input array with the value 50-bars ago, using LineArray() function.

The code is the following:

inputArray Close;
PlotinputArray"input"colorDefaultstyleDots );

bi BarIndex();
lvbi LastValuebi );
x0 lvbi 50;
x1 lvbi;
y0 inputArraylvbi 50 ];
y1 inputArraylvbi ];

PlotLineArrayx0y0x1y1True True ), "line"colorRedstyleThick )

and the output looks like this:
Chart with XShift

LineArray function allows to calculate the extension automatically if we set EXTEND argument to True, however – all the calculations in AFL language are performed within the ‘real bars’ area, i.e. on the available elements of the array, between array item 0 until array item (Barcount-1).

To calculate and display the values that extend past the very last bar available in the array we will use technique explained below:

  1. first we shift the input back (to the left) by N bars, so the real input data would occupy earlier part of the array and we would have extra bars at the end for the calculation of extended arrays
  2. now we calculate the position of arrays on such shifted
  3. shift the displayed output forwards with XSHIFT functionality of Plot function (so the calculated extensions would get aligned onto the blank bars as a result).

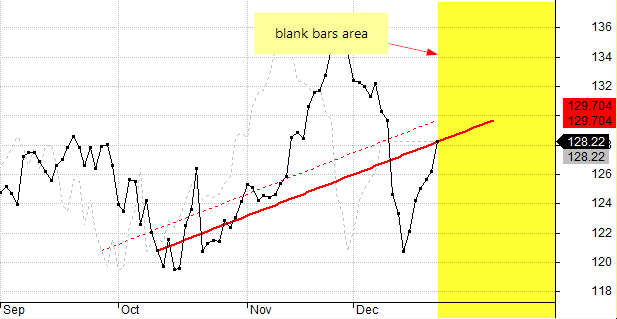
If our original input array contains 200 bars and the line was drawn between bar 150 and the bar 200, then our aim is to shift the array that way, so the line would occupy the bars between bar 140 and bar 190, while the remaining 10 bars at the end of the array could be used for calculating the extended part of the line. Then – using XSHIFT we could place the array back into its original position.

inputArray Close;
PlotinputArray"input"colorDefaultstyleDots );

// here we shift the input array to the left
shift 10;
inputArray RefinputArrayshift );

// calculations of the x-y coordinates of the LineArray
// take into account the fact that array has been shifted
bi BarIndex();
lvbi LastValuebi );
x0 lvbi 50 shift;
x1 lvbi shift;
y0 inputArraylvbi 50 shift ];
y1 inputArraylvbi shift ];

// lineArray shifted back to original (correct) position with XSHIFT
PlotLineArrayx0y0x1y1TrueTrue ), "line"colorRedstyleThickNullNullshift );

//positions that were used for calclations before using xshift
PlotinputArray"input shifted"colorLightGreystyleDashed );
PlotLineArrayx0y0x1y1TrueTrue ), "line shifted"colorRedstyleDashed )

Chart with XShift

Dashed lines in the above chart show the shifted positions of the input array and calculated LineArray before using XSHIFT (i.e. on the bars that were used for actual calculations)

Drawing indicators on a subset of visible bars

By default, the Plot function draws the graph for all visible bars. In some situations however, we may want to draw some selected bars, leaving remaining chart space unaffected.

To achieve that – we simply assign Null value for the bars that we want to skip. Our graph will just be drawn for the non-null bars.

This simple example draws candlesticks only on Mondays and leaves empty all the other days.

IsMonday DayOfWeek() == 1;
// assign Close for Mondays, otherwise assign Null
Data IIfIsMondayCloseNull );
// plot the data
PlotData"Chart of Mondays"colorDefaultstyleCandle )

The following example shows how to restrict the visibility to last N bars. The code defines a custom function, which can be called later on for the arrays we want to show only partially.

// custom function definition
function LastNBars( array, bars )
{
    
bi BarIndex();
    
lvbi LastValuebi );

    
// use Null value for bars other than last N
    
return IIfbi lvbi bars, array, Null );
}

// price plot
PlotClose"Close"colorDefaultstyleBar );

// MA-50 restricted to last 10-bars only
line MAClose50 );
PlotLastNBarsline10 ), "last 10 bars"colorRed );

// shaded area
PlotLastNbarsTrue10 ), ""colorYellowstyleArea|styleOwnScale|styleNoLabel010, -)

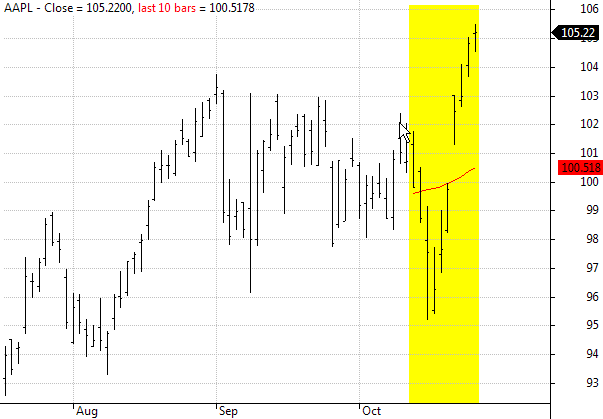
Draw chart only for last N bars

In the above chart both Moving average (red line) and yellow shading area have been restricted to last 10-bars only.

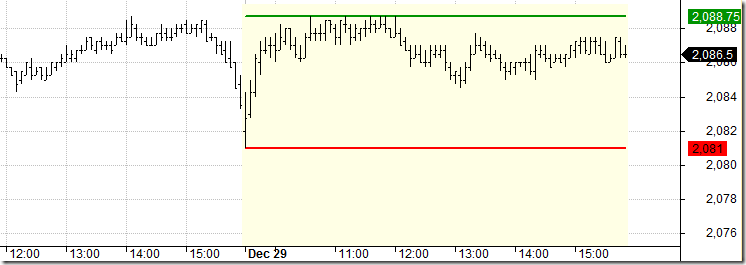
In a similar way we can restrict the visibility to most recent day only in intraday chart:

// custom function definition
function ShowLastDay( array )
{
    
dn datenum();
    
lastDay dn == LastValuedn );

    return 
IIflastDay, array, Null );
}

// price plot
PlotClose"Close"colorDefaultstyleBar );

// daily high / low on last day only
dailyH TimeFrameGetPrice("H"inDaily );
dailyL TimeFrameGetPrice("L"inDaily );
PlotShowLastDaydailyH ), "dailyH"colorGreenstyleThick  );
PlotShowLastDaydailyL ), "dailyL"colorRedstyleThick  );

// shaded area
colorPaleYellow ColorBlend(colorWhitecolorYellow0.1);
style styleArea styleOwnScale styleNoLabel;
PlotShowLastDay), ""colorPaleYellowstyle010, -)

Draw chart only for last day

Other practical implementations of such technique is presented in these formulas:
http://www.amibroker.com/kb/2007/03/24/how-to-plot-a-trailing-stop-in-the-price-chart/
http://www.amibroker.com/kb/2014/10/10/how-to-draw-regression-channel-programatically/

How to add full name to the Price chart title

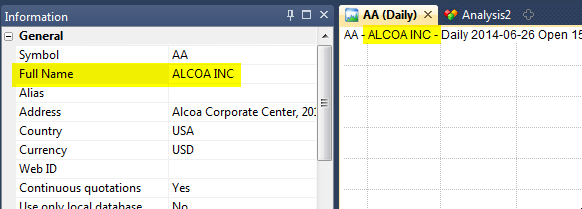
The full name of the security can be retrieved in AFL using FullName() function.

In order to add such information to the built-in Price chart, we need to do the following:

  1. Click on the chart with right mouse button
  2. Choose Edit Formula from the context menu
  3. Modify the Title definition line, the built-in code contains:_N(Title StrFormat("{{NAME}} - {{INTERVAL}} {{DATE}} Open %g, Hi %g, Lo %g, Close %g (%.1f%%)",
                         
    OHLCSelectedValueROCC) ) ))

    We need to change it into:

    _N(Title StrFormat("{{NAME}} - " +
                          
    FullName() +
                          
    " - {{INTERVAL}} {{DATE}} " +
                          
    "Open %g, Hi %g, Lo %g, Close %g (%.1f%%) Vol %.0f",
                          
    OHLCSelectedValueROCC) ), ) )
  4. To apply these changes choose Tools->Apply Indicator from the menu.

If we have Full name information imported into the database and visible in Symbol->Information window, the updated chart title will show it next to the ticker name.

Fullname in the chart title

Setting default color for studies

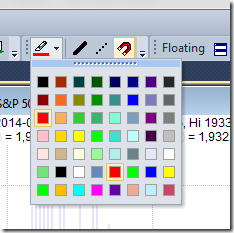
In order to select color before drawing the trendline or other studies it is enough to choose the color in Color Pick (Select color) toolbar button located in the Format toolbar.

Color Pick

This allows to avoid drawing the line and changing color later on in line Properties dialog.

How to measure price / percentage distance on the chart

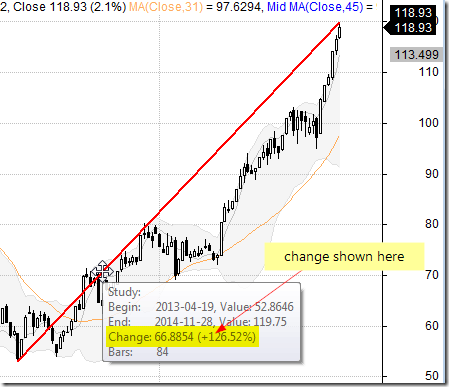
The easiest way to manually measure distance between two points on the chart is to use a regular trend-line drawing tool for this purpose.

First we need to draw the line between the selected points (Insert->Trendline). It may be useful to have Insert->Snap to Price option marked if we want our line to start and end exactly at OHLC levels of respective price bar.

Once trend line is drawn, we need to hover the mouse cursor over the line and the tooltip will show both price and percentage change between the Start and End points:

Measure distance

Using loops with TimeFrame functions

AmiBroker features a powerful set of TimeFrame functions that allow combining different time intervals in single system formula. There is one aspect of TimeFrame functions that is important to understand to properly use them. When we switch to higher interval using TimeFrameSet function – the BarCount does not really change – TimeFrameSet just squeezes the arrays so we have first N-bars filled with Null values (undefined) and then – last part of the array contains the actual time-compressed values. This is explained in details here: http://www.amibroker.com/guide/h_timeframe.html

Normally it does not present any problem as long as we use array functions, because array functions check for Nulls occuring at the beginning of the data series and skip them appropriately. The story is different when we try to use loops.

If we want to use looping code in higher time-frame, we can not really start our calculations from the bar 0, because it would contain Null instead of real data. That is why we would first need to detect were the actual compressed data begins and start calculations on that particular bar instead.

Here is a sample formula showing how to compute AMA function in a loop, based on weekly data (the code should be applied in Daily interval). Code will identify the first non-Null bar and initialize the first AMA value with Close of that bar, then it will continue calculations

PlotClose"Close"colorBlack );

// switch to higher timeframe
TimeFrameSetinWeekly );

smooth 0.2;
myAMA Close;

// search for start (non-null) bar
for( start 0start BarCountstart++ )
{
   if( 
NOT IsNullClosestart ] ) ) break;
}

// looping code
for ( start 1BarCounti++ )
{
    
// this part will execute only after the first non-null bar has been identified
    
myAMA] = Close] * smooth myAMA] * ( smooth );
}

// regular AMA function for comparison
weeklyAMA AMAClose0.2 );

//restore original time-frame
TimeFrameRestore();

// plot expanded values retrieved from Weekly frame
PlotTimeFrameExpandmyAMAinWeekly ), "weekly AMA loop"colorRed );
PlotTimeFrameExpandweeklyAMAinWeekly ), "weekly AMA"colorBluestyleDots )

The code above is good for pre-5.90 versions. In version 5.90 we have a new function that counts Nulls for us making the code shorter and clearer, as shown below:

Version5.90 );

PlotClose"Close"colorBlack );

// switch to higher timeframe
TimeFrameSetinWeekly );

smooth 0.2;
myAMA Close;

// new 5.90 function that counts leading Nulls
start NullCountClose );

// looping code
for ( start 1BarCounti++ )
{
    
// this part will execute only after the first non-null bar has been identified
    
myAMA] = Close] * smooth myAMA] * ( smooth );
}

// regular AMA function for comparison
weeklyAMA AMAClose0.2 );

//restore original time-frame
TimeFrameRestore();

// plot expanded values retrieved from Weekly frame
PlotTimeFrameExpandmyAMAinWeekly ), "weekly AMA loop"colorRed );
PlotTimeFrameExpandweeklyAMAinWeekly ), "weekly AMA"colorBluestyleDots )

How to plot daily High and Low on intraday chart

The AFL offers a set of time-frame functions which allow to use multiple intervals within a single formula (the topic is explained in details in the following tutorial chapter: http://www.amibroker.com/guide/h_timeframe.html)

In situations, where we do not need to calculate any indicators based on higher interval data, but rather just read OHLC, V or OI arrays – TimeFrameGetPrice is the most convenient function to use.

To plot daily High and Low levels we just need to read the respective arrays calling: TimeFrameGetPrice(“H”, inDaily ) – the first argument specifies the array we want to read, the second argument defines the interval we are reading data from. As with any other TimeFrame functions – we can only read data from higher intervals, so it is possible to read daily data when we work with 1-minute quotes, but not the other way round.

Here is a sample formula which draws daily high and low in the intraday chart:

PlotClose"Close"colorDefaultstyleBar );
PlotTimeFrameGetPrice("H"inDaily ), "day high"colorGreenstyleStaircase styleThick);
PlotTimeFrameGetPrice("L"inDaily ), "day low"colorRedstyleStaircase styleThick)

TimeFrameGetPrice() functions allow also to easily shift the reading by N-bars of the higher interval if we specify that in 3rd argument of the function, so calling TimeFrameGetPrice( “H”, inDaily, -1 ) will return the high of previous day.

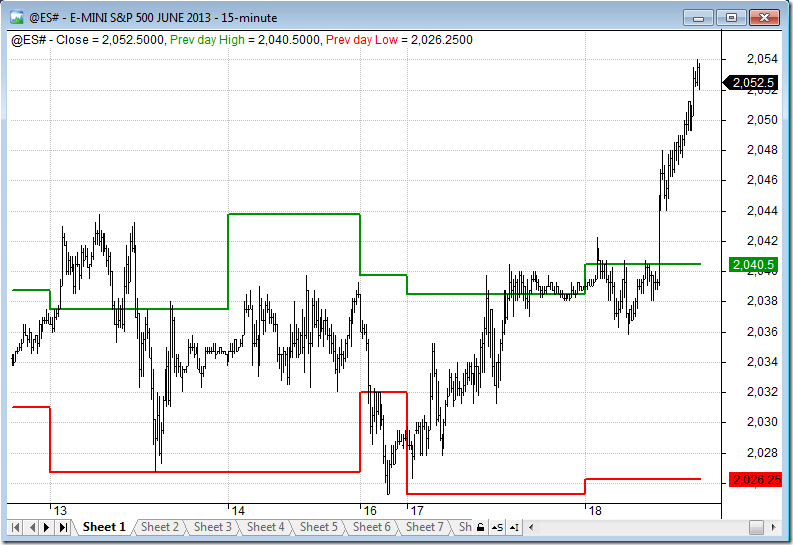
The following code draws high / low of previous day on top of the intraday chart:

PlotClose"Close"colorDefaultstyleBar );
hlstyle styleStaircase styleThick;
PlotTimeFrameGetPrice"H"inDaily, -), "Prev High"colorGreenhlstyle );
PlotTimeFrameGetPrice"L"inDaily, -), "Prev Low"colorRedhlstyle )

Daily H-L

How to adjust the number of blank bars in right margin

The default number of bars shown in the right-hand side of the chart area is defined in Tools->Preferences->Charting:

Blank bars

It is also possible to extend the blank bars area manually. Pressing END key on the keyboard will add 10 extra bars with each keystroke. Pressing HOME will reset the blank bars area back to default value from Preferences.

Number of bank bars can also be controlled using SetChartOptions() function from the code.

SetChartOptions00chartGridMiddle00100 );
PlotClose"Close"colorDefaultstyleBar )

Detailed documentation of SetChartOptions function is available in the manual:
http://www.amibroker.com/f?SetChartOptions

Indicators based on user values rather than standard OHLC prices

Sometimes we may want to calculate indicators based not only on standard OHLC prices but on some other user-definable values. Some functions like RSI or CSI have additional versions (RSIa, CCIa respectively) that accept custom input array. In this case it is very easy to calculate the indicator based on user defined value. For example RSI from average of High and Low prices could be written as follows:

customArray = ( High Low ) / 2;

PlotRSIacustomArray14 ), "RSI from (H+L)/2"colorRed )

But many of the built-in indicators available in AFL as functions refer indirectly to standard OHLC arrays and their parameters do not offer array argument as one of inputs.

Fortunatelly there is an easy way to provide custom array as input for any other built-in functions. For this purpose, it is enough to override OHLC arrays (or just Close if the indicator only uses Close as input) within the code before calling given function and assign our custom array. As a simple example, let us consider calculating MACD indicator out of average of High and Low prices as input.

procedure SaveRestorePricesDoSave )
{
  global 
SaveOSaveHSaveLSaveCSaveV;

  if( 
DoSave )
  {
     
SaveO Open;
     
SaveH High;
     
SaveL Low;
     
SaveC Close;
     
SaveV Volume;
  }
  else
  {
    
Open SaveO;
    
High SaveH;
    
Low SaveL;
    
Close SaveC;
    
Volume SaveV;
  }
}

// save OHLCV arrays
SaveRestorePricesTrue );

// calculate our array
customArray = ( High Low ) / 2;

// override built-in array(s)
Close customArray;

// calculate our function, MACD and Signal in this case
PlotMACD1226 ), "MACD"colorRed );
PlotSignal1226), "Signal"colorBlue );

// restore OHLCV arrays
SaveRestorePricesFalse )

The code first calculates the custom array (we use just use average of High and Low prices in this example, but of course the calculations may be more complex), then assigns the result of these calculations to Close overriding the regular values stored in close array. Then – when we call MACD() function which uses Close as input – it will be based on the modified values.

The above operations do not affect the underlying database at all – the prices are overridden only for the purpose of calculation of this particular formula and other charts / indicators are not affected at all.

How to sync a chart with the Analysis window

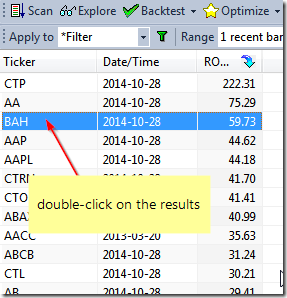
When we want to sync a chart with the selected symbol in the Analysis results list, it is enough just to double-click on the particular line in the list and AmiBroker will automatically switch the selected symbol and interval to match the Analysis window.

Sync by double click

Additionally, when we browse through Scan or Backtest results, double-clicking would be an equivalent of Show arrows for all raw signals option from the context menu and would display trading arrows in the chart to match the signals generated by the formula.

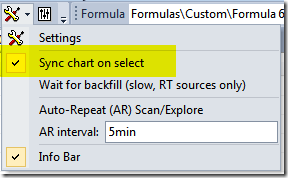
If we find that double-clicking is too much work, it is possible to mark Sync chart on select option in Analysis window settings menu:

Sync chart on select

and then single click to select a chart is enough to sync the symbol in the chart. This also allows to use keyboard (up/down cursor keys) to change the selection and sync automatically.

When we have more than one chart window displayed, then Analysis window will always sync the last opened chart window.

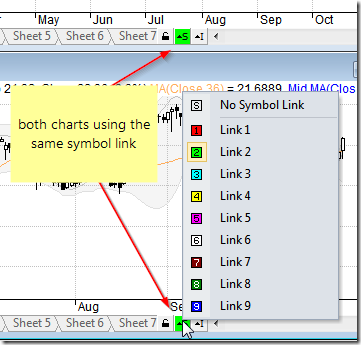
If we want to sync multiple chart windows we can use Symbol Link feature. Once multiple windows have the same “Symbol Link” color selected, browsing through the results list in Analysis automatically will automatically sync all linked chart windows (e.g. for the purpose of showing different intervals in each of the charts).

Linking

More information about chart link functionality is available in tutorials at:
http://www.amibroker.com/guide/h_sheets.html. See also video tutorial showing how to use symbol linking: http://www.amibroker.com/video/FloatAndLink.html

« Previous PageNext Page »